


Esophageal varices are one of the complications of portal hypertension in cirrhotic patients that lead to high morbidity and mortality. Our aim was to assess the fecal calprotectin (FC) level in Egyptian cirrhotic patients as a non-invasive marker for the presence of esophageal varices.
Materials and methodsThe current study included 250 participants in the period from June 2019 to November 2020, divided into three groups: group 1: 100 HCV cirrhotic patients with esophageal varices that would then be subdivided, according to the Paquet classification; group 2: 100 HCV cirrhotic patients without esophageal varices; group 3: 50 normal age and sex-matched healthy subjects as the control group. Patients with other causes of abnormal calprotectin results were excluded.
ResultsThe comparison of FC in the three study groups revealed a statistically significant difference, with FC levels higher in groups 1 and 2 (mean 66.4±10.41 and 48.4±10.92, respectively). There was a significant difference in FC levels between the subgroups, subdivided according to the Paquet classification (P=.001). FC levels were higher in the grade III and IV subgroups. FC in the diagnosis of HCV cirrhotic patients with esophageal varices showed the best performance when the cut-off value was >55; AUC was 0.918, with 92% sensitivity, 95% specificity, and 93% accuracy.
ConclusionFC levels serve as a screening tool for esophageal varices. FC was higher in cirrhotic patients with esophageal varices, especially in the grade III and IV subgroups, according to the Paquet classification.
Las várices esofágicas son una de las complicaciones de la hipertensión portal en pacientes cirróticos, lo cual lleva a una alta morbilidad y mortalidad. Nuestro objetivo fue evaluar el nivel de calprotectina fecal (CF) en pacientes cirróticos egipcios como marcador no invasivo de la presencia de várices esofágicas.
Materiales y métodosEl presente estudio incluyó a 250 participantes en el período de junio de 2019 a noviembre de 2020, divididos en tres grupos: grupo 1: 100 pacientes cirróticos por VHC con várices esofágicas, posteriormente subdivididos según la clasificación de Paquet; grupo 2: 100 pacientes cirróticos por VHC sin várices esofágicas; grupo 3: 50 sujetos sanos emparejados por edad y sexo como grupo de control. Se excluyó a pacientes con otras causas de calprotectina anormal.
ResultadosLa comparación entre los tres grupos estudiados en cuanto a CF reveló una diferencia estadísticamente significativa. Los niveles de CF fueron mayores en los grupos 1 y 2, con medias de 66.4±10.41 y 48.4±10.92, respectivamente. Existió una diferencia significativa en los niveles de CF entre los subgrupos, subdivididos según la clasificación de Paquet (P=.001). Los niveles de CF fueron más altos en los subgrupos de grado III y IV. La CF en el diagnóstico de pacientes cirróticos por VHC con várices esofágicas mostró el mejor desempeño cuando el punto de corte fue > 55; el área bajo la curva (AUC) fue 0.918, con 92% de sensibilidad, 95% de especificidad y 93% de precisión.
ConclusiónLos niveles de CF sirven como herramienta de tamizaje para várices esofágicas. La CF fue mayor en pacientes cirróticos con várices esofágicas, especialmente en los subgrupos de grado III y IV, según la clasificación de Paquet.
Cirrhosis is considered an end result of the ongoing inflammatory and fibrotic process, including diffuse degeneration and necrosis of hepatocytes, replacement of liver parenchyma by fibrotic tissues and regenerative nodules, and loss of liver architecture. Cirrhosis is the twelfth leading cause of death worldwide1,2.
The prevalence of hepatitis C virus (HCV) infection varies considerably by geographical region; African and Asian countries reported higher prevalence rates than those in North America and Europe, and the country of Australia. Egypt had the highest prevalence of HCV in the world (predominantly genotype 4), with 15%–22% of the general population infected. This has been attributed to a community-wide treatment campaign conducted by the Egyptian Ministry of Health, from the 1950s to the 1980s, that utilized parenteral tarter emetic to control the Schistosomiasis infestation. Unfortunately, it resulted in a large reservoir of HCV infection in the country through needle re-usage at the time of treatment3,4.
At present there are no accurate statistics, but all estimates state that prevalence in 2018 had declined to 6%–8%. Egypt will likely progress robustly towards HCV elimination by 20305.
Portal hypertension is defined as a hepatic venous pressure gradient >5mm, with complications arising, once it exceeds 10mmHg. Portal hypertension is one of the most relevant outcomes of cirrhosis, leading to varices, ascites, hepatorenal syndrome, and splenomegaly6.
Esophageal varices are portosystemic collaterals found in the submucosa of the lower esophagus. Variceal bleeding accounts for 10%–30% of all cases of upper gastrointestinal bleeding. It can be divided into 4 grades, according to the Paquet classification, regarding size and circumferential progression7.
Calprotectin is an abundant calcium-binding protein that is derived predominantly from neutrophils, and to a lesser extent, from monocytes and reactive macrophages. Calprotectin constitutes about 5% of the total protein and 60% of the cytosolic protein in human neutrophils8.
Our aim was to assess fecal calprotectin (FC) levels in different HCV cirrhotic patients as a non-invasive marker for the presence of esophageal varices.
Materials and methodsParticipantsA cross-sectional study was carried out on 250 patients of both sexes presenting with HCV and cirrhosis that underwent upper gastrointestinal endoscopy, in the period from June 2019 to November 2020. They were divided into the 3 following groups, according to the Baveno III criteria:
Group 1: 100 HCV cirrhotic patients with esophageal varices that were later subdivided, according to the Paquet classification.
Group 2: 100 HCV cirrhotic patients without esophageal varices.
Group 3: 50 normal subjects as the control.
Exclusion criteria: Inflammatory bowel disease, radiation proctitis, hematologic disease, malignancy, recent surgical intervention of the small or large intestine within the last 6 months, infectious diarrhea including bacterial, viral, and parasitic diarrhea, a history of prolonged use of antibiotics, nonsteroidal anti-inflammatory drug abuse within the last 6 months, diabetes mellitus, patients with kidney or heart disease, patients with hepatic encephalopathy or spontaneous bacterial peritonitis, and patients with other causes of cirrhosis (e.g., hepatitis B virus, hemochromatosis, alcoholic cirrhosis).
All patients and controls gave their informed consent after the nature, steps, and aim of the study were explained to them.
The study was conducted after it was approved by the medical ethics committee of the Faculty of Medicine of Alexandria University, Egypt. All patients in this study underwent a full clinical assessment, through history taking, physical examination, and the following laboratory tests: complete blood count, alanine transaminase, aspartate transaminase, aspartate transaminase/alanine transaminase ratio, alkaline phosphatase, total and direct serum bilirubin, serum albumin, blood urea nitrogen, serum creatinine, prothrombin time, international normalized ratio, C-reactive protein (CRP), and FC detected by enzyme-linked immunosorbent assay (ELISA) (the cutoff point was 50μg/g for correlating our results with those of existing tests). The different grades of esophageal varices were assessed through upper gastrointestinal endoscopy, using the Paquet classification.
Statistical analysisData were entered into the computer using the IBM SPSS software package version 24.0. Qualitative data were described using number and percentage. Comparison between different groups regarding the categorical variables was tested using the chi-square test. The quantitative data were described using mean and standard deviation for the normally distributed data. The comparison between 2 independent populations was carried out for the normally distributed data, using the independent t-test, whereas the F-test (ANOVA) was used for analyzing more than 2 populations. Significance test results were expressed as two-tailed probabilities. Significance of the results was judged at the 5% level.
Ethical considerationsStatement of informed consent: A written statement of informed consent was obtained from each patient in the study. For underage patients, the statement of informed consent was obtained from their guardians. The authors declare that this article contains no personal information that could identify the patients.
All study procedures involving human participants were performed in accordance with the ethical standards of the institutional research committee (Medical Research Ethics Committee of the Alexandria Faculty of Medicine, Egypt) and the 1964 Declaration of Helsinki and its later amendments or comparable ethical standards.
ResultsThe current study included 3 groups; group 1: 100 HCV cirrhotic patients with esophageal varices, group 2: 100 HCV cirrhotic patients without esophageal varices, and group 3: 50 normal subjects as control (age and sex-matched healthy participants).
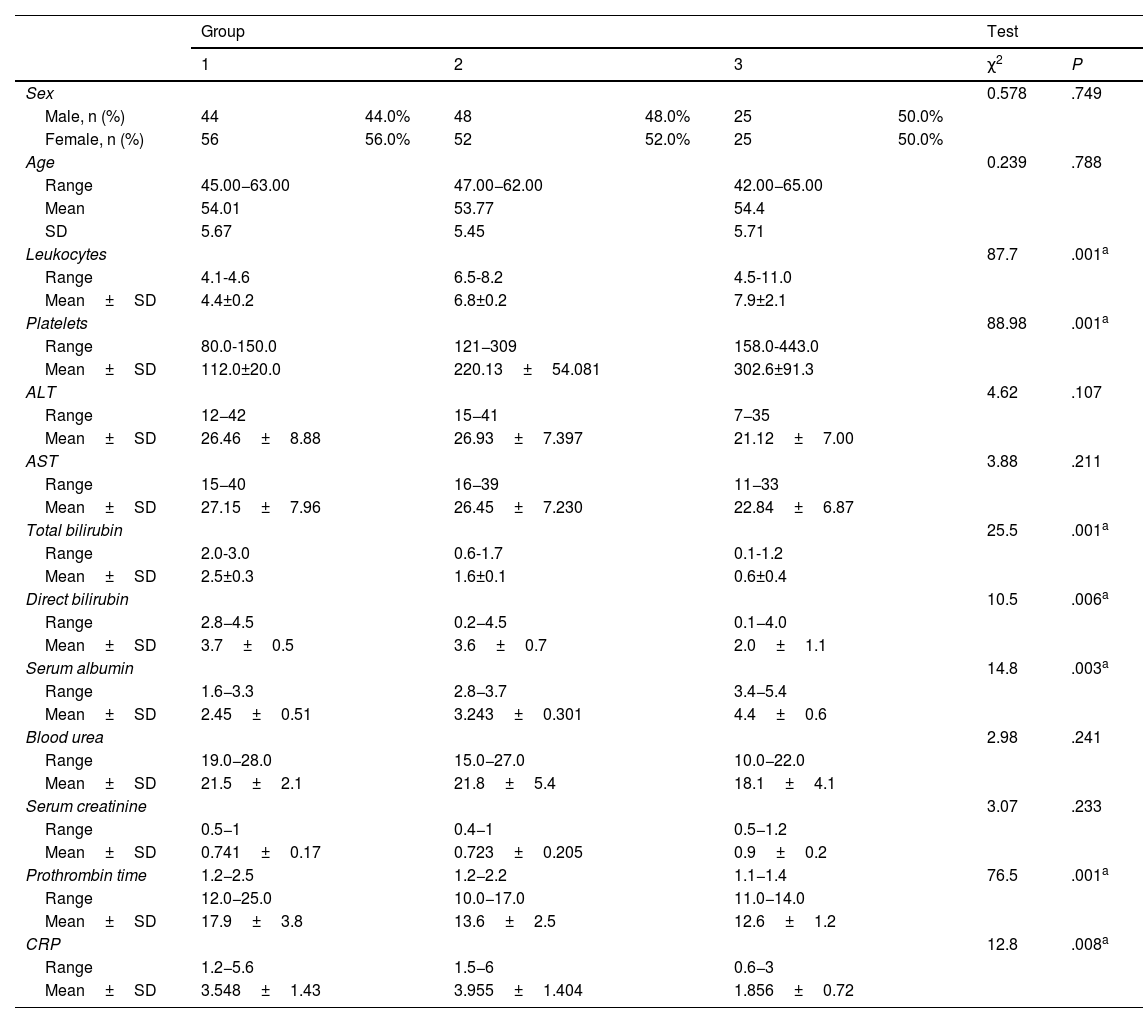
Table 1 shows the demographic and laboratory parameters of the study groups. No statistically significant differences were found between group 1, group 2, and group 3 (control group), regarding age, sex, and laboratory parameters, with the exception of leukocytes, platelet levels, total and direct bilirubin, serum albumin, prothrombin time, and CRP. The statistically significant difference between the groups for those parameters was P=.001, P=.001, P=.001, P=.006, P=.003, P=.001, and P=.008, respectively.
Comparison between the 3 study groups, regarding demographic data and laboratory findings.
| Group | Test | |||||||
|---|---|---|---|---|---|---|---|---|
| 1 | 2 | 3 | χ2 | P | ||||
| Sex | 0.578 | .749 | ||||||
| Male, n (%) | 44 | 44.0% | 48 | 48.0% | 25 | 50.0% | ||
| Female, n (%) | 56 | 56.0% | 52 | 52.0% | 25 | 50.0% | ||
| Age | 0.239 | .788 | ||||||
| Range | 45.00−63.00 | 47.00−62.00 | 42.00−65.00 | |||||
| Mean | 54.01 | 53.77 | 54.4 | |||||
| SD | 5.67 | 5.45 | 5.71 | |||||
| Leukocytes | 87.7 | .001a | ||||||
| Range | 4.1-4.6 | 6.5-8.2 | 4.5-11.0 | |||||
| Mean±SD | 4.4±0.2 | 6.8±0.2 | 7.9±2.1 | |||||
| Platelets | 88.98 | .001a | ||||||
| Range | 80.0-150.0 | 121−309 | 158.0-443.0 | |||||
| Mean±SD | 112.0±20.0 | 220.13±54.081 | 302.6±91.3 | |||||
| ALT | 4.62 | .107 | ||||||
| Range | 12−42 | 15−41 | 7−35 | |||||
| Mean±SD | 26.46±8.88 | 26.93±7.397 | 21.12±7.00 | |||||
| AST | 3.88 | .211 | ||||||
| Range | 15−40 | 16−39 | 11−33 | |||||
| Mean±SD | 27.15±7.96 | 26.45±7.230 | 22.84±6.87 | |||||
| Total bilirubin | 25.5 | .001a | ||||||
| Range | 2.0-3.0 | 0.6-1.7 | 0.1-1.2 | |||||
| Mean±SD | 2.5±0.3 | 1.6±0.1 | 0.6±0.4 | |||||
| Direct bilirubin | 10.5 | .006a | ||||||
| Range | 2.8−4.5 | 0.2−4.5 | 0.1−4.0 | |||||
| Mean±SD | 3.7±0.5 | 3.6±0.7 | 2.0±1.1 | |||||
| Serum albumin | 14.8 | .003a | ||||||
| Range | 1.6−3.3 | 2.8−3.7 | 3.4−5.4 | |||||
| Mean±SD | 2.45±0.51 | 3.243±0.301 | 4.4±0.6 | |||||
| Blood urea | 2.98 | .241 | ||||||
| Range | 19.0−28.0 | 15.0−27.0 | 10.0−22.0 | |||||
| Mean±SD | 21.5±2.1 | 21.8±5.4 | 18.1±4.1 | |||||
| Serum creatinine | 3.07 | .233 | ||||||
| Range | 0.5−1 | 0.4−1 | 0.5−1.2 | |||||
| Mean±SD | 0.741±0.17 | 0.723±0.205 | 0.9±0.2 | |||||
| Prothrombin time | 1.2−2.5 | 1.2−2.2 | 1.1−1.4 | 76.5 | .001a | |||
| Range | 12.0−25.0 | 10.0−17.0 | 11.0−14.0 | |||||
| Mean±SD | 17.9±3.8 | 13.6±2.5 | 12.6±1.2 | |||||
| CRP | 12.8 | .008a | ||||||
| Range | 1.2−5.6 | 1.5−6 | 0.6−3 | |||||
| Mean±SD | 3.548±1.43 | 3.955±1.404 | 1.856±0.72 | |||||
ALT: alanine aminotransferase; AST: aspartate aminotransferase; CRP: C-reactive protein; SD: standard deviation.
Group 1: HCV cirrhotic patients with esophageal varices.
Group 2: HCV cirrhotic patients without esophageal varices.
Group 3: 50 normal subjects as control.
χ2: chi square test; p: p value for the study group comparisons.
HCV cirrhotic patients with esophageal varices (group 1) were classified into 4 grades, according to the Paquet classification. A total of 71% of the patients presented with grades I and II (Table 2).
Table 3 shows the different FC levels in the 3 study groups. There was a significant difference in FC levels between groups 1, 2, and 3 (P=.0001). FC levels were higher in group 1 and group 2, with a mean of 66.4±10.41 and 48.4±10.92, respectively.
Comparison between the 3 study groups, regarding the fecal calprotectin level.
| Group | P value | |||
|---|---|---|---|---|
| 1 | 2 | 3 | ||
| FC | ||||
| Range | 50.0−95.0 | 28.0−65.0 | 20.0−45.0 | 194.79 |
| Mean±SD | 66.4±10.41 | 48.4±10.92 | 32.82±7.95 | .0001a |
FC: fecal calprotectin; SD: standard deviation.
p: p value for the chi-square test for comparing the 3 groups.
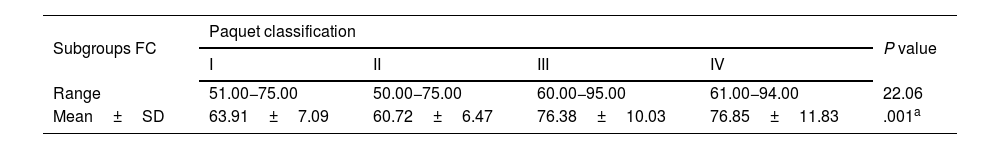
Table 4 shows the FC levels in the subgroups of the different grades of esophageal varices, according to the Paquet classification. There was a significant difference in terms of FC levels between the subgroups (P=.001). FC levels were higher in the grade III and grade IV subgroups.
Relation between fecal calprotectin and the Paquet classification.
| Subgroups FC | Paquet classification | P value | |||
|---|---|---|---|---|---|
| I | II | III | IV | ||
| Range | 51.00−75.00 | 50.00−75.00 | 60.00−95.00 | 61.00−94.00 | 22.06 |
| Mean±SD | 63.91±7.09 | 60.72±6.47 | 76.38±10.03 | 76.85±11.83 | .001a |
FC: fecal calprotectin; SD: standard deviation.
The receiver operating characteristic (ROC) curve analysis was utilized to evaluate the performance of fecal calprotectin for diagnosing HCV cirrhotic patients with esophageal varices. The cutoff value of >55 showed the best performance, with an area under the ROC curve (AUC) of 0.918, 92% sensitivity, and 95% specificity (Table 5) (Fig. 1).
Sensitivity, specificity, and accuracy of fecal calprotectin for diagnosing HCV cirrhotic patients with esophageal varices.
| AUC | P value | Cutoff value | Asymptomatic 95% confidence interval | |
|---|---|---|---|---|
| Lower limit | Upper limit | |||
| 0.918 | .0001a | >55 | 0.887 | 0.949 |
| Sensitivity | 92.0 | |||
| Specificity | 95.0 | |||
| Accuracy | 93.0 | |||
AUC: area under the curve.

The cutoff value of 65.0 for FC showed the best performance, with an AUC of 0.782, 80% sensitivity, 75% specificity, and 78% accuracy (P<.001), for predicting the patients with a high grade in the Paquet classification (Table 6) (Fig. 2).

Esophageal varices due to portal hypertension induced by cirrhosis are one of the life-threatening complications of liver failure, with increased comorbidity and mortality9–11. Esophagogastroduodenoscopy is the diagnostic modality of choice for the screening of upper gastrointestinal bleeding due to its high sensitivity and specificity. However, it is an invasive, expensive, and time-consuming procedure12,13.
In the present study, we found that FC levels in cirrhotic patients were significantly increased, compared with healthy subjects. Similar to our study, Homann et al. investigated the prognostic value of calprotectin in cirrhotic patients, showing that high levels of plasma calprotectin were related to poor survival in alcohol-related cirrhosis14. Tokmak et al. found a statistically significant difference between cirrhotic patients and controls (P=.039), in which the median FC levels were 168.8mg/kg (IQR 73.1–315.6mg/kg) for the cirrhotic patients versus 9.8mg/kg (IQR 6.8–13.8mg/kg) for the control group15. Yagmur et al.8 also reported that FC levels in cirrhotic patients were significantly higher in cirrhotic patients than in healthy controls.
Those findings confirm that cirrhotic patients are more susceptible to bacterial infections due to hepatic and reticuloendothelial system dysfunction, leading to an increase in the migration of bacteria or bacterial products from the intestinal lumen16.
In decompensated cirrhosis, small intestinal dysmotility and altered bile composition contribute to bacterial overgrowth and the development of endotoxemia and infectious complications17.
Bacterial infections occur more frequently in cirrhotic patients admitted for gastrointestinal bleeding than for other causes18. Bacterial infections can aggravate esophageal variceal bleeding by increasing sinusoidal pressure and altering hemostasis, as well as through endotoxemia, which are triggers for esophageal variceal bleeding in cirrhotic patients19, leading to enhanced migration of granulocytes and monocytes towards chemotactic substances in the bowel20. In addition, bacterial components derived from the intestinal lumen act as stimuli for the release of mediators, such as calprotectin from granulocytes and monocytes, increasing the amount of calprotectin in feces. Thus, the presence of calprotectin in feces is a consequence of migration of neutrophils into the gastrointestinal tissue due to an infection or an inflammatory process21.
There are no studies in the literature on the relation between FC and cirrhotic patients with esophageal varices versus cirrhotic patients without esophageal varices and healthy subjects. In our study, we found that FC levels in cirrhotic patients with esophageal varices were significantly increased, compared with cirrhotic patients without esophageal varices and healthy subjects. FC in the diagnosis of HCV cirrhotic patients with esophageal varices showed the best performance, when the cutoff value was >55, with an AUC of 0.918, 92% sensitivity, 95% specificity, and 93% accuracy.
In the different subgroups of esophageal varices, according to the Paquet classification, FC levels were higher in the grade III and IV subgroups and the difference was statistically significant (P=.001). For patients with a high grade in the Paquet classification, the cutoff value of 65.0 for FC showed the best performance, with an AUC of 0.782, 80% sensitivity, 75% specificity, and 78% accuracy (P<.001).
Many studies have shown that FC increases with the severity of complications in cirrhotic patients. Tokmak et al.15 found that FC levels were significantly higher in the spontaneous bacterial peritonitis group (363.8mg/kg) and the highest FC level (2108mg/kg) was determined in that group. Yagmur et al.8 concluded that the highest FC levels were determined in the spontaneous bacterial peritonitis group. Alempijević et al.22 confirmed a significantly higher level of FC in patients with cirrhosis (P<.001) but there were no significant differences in FC values between the patients with different stages of liver cirrhosis, according to the Child-Pugh classification and MELD score (P>.05). They also reported a statistically significant difference when comparing FC using the West Haven criteria for grading hepatic encephalopathy (P<.001), whereas there was no correlation between the number connection test and the serum concentration of ammonium ion (P>.05)22.
In addition, Tokmak et al.15, Yagmur et al.8, and Gundling et al.23 investigated the relation between FC and systemic inflammation markers, such as leukocytes, CRP, interleukin-6, interleukin-8, and interleukin-10, and they found no significant influence of those laboratory parameters on FC levels. The increase in FC levels, before systemic inflammatory marker elevation, strengthens the role of FC for diagnosing the onset and severity of complications in cirrhotic patients.
The major strength of our study is that it is the first to address the relation between FC and esophageal varices in Egyptian HCV cirrhotic patients and compare the different grades of esophageal varices and their relation to the FC level.
In conclusion, the present study showed that FC was significantly increased in cirrhotic patients with esophageal varices, compared with cirrhotic patients without esophageal varices and healthy subjects. FC levels were higher in the grade III and IV subgroups, showing a statistically significant difference, according to the Paquet classification. Assessing FC may help to identify cirrhotic patients with esophageal varices, given that a significant correlation emerged between elevated FC and portal hypertension complications. However, the small sample size of our study could have led to a loss of statistical significance at certain points.
Financial disclosureThis research did not receive any specific grant from funding agencies in the public, commercial, or not-for-profit sectors.
Conflict of interestThe authors declare that they have no conflict of interest.
All the authors would like to thank, Dr Ahmed EL Lakany for the concept, data analysis, and data acquisition of the study.
Please cite this article as: Header DA, Ellakany WI, Ellakany AI. El nivel de calprotectina fecal como marcador de várices esofágicas en pacientes egipcios cirróticos por VHC. Rev Gastroenterol Méx. 2023;88:333–340.

