Liver cirrhosis in Mexico is one of the most important causes of death in persons between the ages of 25 and 50 years. One of the reasons for therapeutic failure is the lack of knowledge about the molecular mechanisms that cause liver disorder and make it irreversible. One of its prevalent anatomical characteristics is an excessive deposition of fibrous tissue that takes different forms depending on etiology and disease stage.
Liver biopsy, traditionally regarded as the gold standard of fibrosis staging, has been brought into question over the past decade, resulting in the proposal for developing non-invasive technologies based on different, but complementary, approaches: a biological one that takes the serum levels of products arising from the fibrosis into account, and a more physical one that evaluates scarring of the liver by methods such as ultrasound and magnetic resonance elastography; some of the methods were originally studied and validated in patients with hepatitis C.
There is great interest in determining non-invasive markers for the diagnosis of liver fibrosis, since at present there is no panel or parameter efficient and reliable enough for diagnostic use.
In this paper, we describe the biomarkers that are currently being used for studying liver fibrosis in humans, their advantages and disadvantages, as well as the implementation of new-generation technologies and the evaluation of their possible use in the diagnosis of fibrosis.
La cirrosis hepática en México es una de las principales causas de muerte en sujetos entre los 25 y los 50 años de edad. Una de las principales razones del fracaso terapéutico es el desconocimiento de los mecanismos moleculares que producen el trastorno hepático y lo hacen irreversible. Entre sus características anatómicas prevalece un depósito excesivo de tejido fibroso que adopta diferentes formas, dependiendo de la etiología y etapa de la enfermedad.
La biopsia hepática, considerada tradicionalmente como la referencia estándar para estadificar la fibrosis, ha sido muy cuestionada en la última década, por lo que se ha propuesto el desarrollo de tecnologías no invasivas basadas en enfoques distintos pero complementarios: uno biológico que considera los niveles séricos de los productos procedentes de la fibrosis y otro físico que evalúa la cicatrización del órgano por métodos tales como, el ultrasonido, la resonancia magnética y la elastografía, algunos de ellos, estudiados y validados inicialmente en pacientes con hepatitis C.
Existe la necesidad de establecer marcadores hepatoespecíficos no invasivos para el diagnóstico de fibrosis hepática, ya que actualmente no se cuenta con un parámetro o panel que cumpla con los criterios de eficacia y confiabilidad, requeridos para su uso diagnóstico.
En este trabajo se describen los biomarcadores empleados actualmente para el estudio de la fibrosis hepática en humanos, incluyendo sus ventajas y desventajas y la implementación de tecnologías de nueva generación, y la evaluación de las posibilidades de su empleo para el diagnóstico.
The liver has the unique role of being the metabolic center of the body. Its average weight in adults is approximately 1,400±270g, with no significant difference related to sex. It is made up of 5 different types of cells that occupy close to 80% of its volume. The remaining 20% corresponds to the extracellular spaces and components of the extracellular matrix.1
Fibrosis is a common response of the liver to chronic lesion produced by a variety of aggressions that include metabolic diseases, viral infections, alcohol abuse, drug abuse, and autoimmune attack targeting hepatocytes and bile ducts; congenital abnormalities are also a cause.
In the space of Disse of the normal liver, an organized group of proteins known as the extracellular matrix (ECM) can be observed in direct contact with the basal lamina (low-density material similar to the «basal membrane» that is formed by type IV collagen together with laminin and entactin along the sinusoidal wall).2 It makes up about 0.5% of the total weight of the liver and is the support for the parenchymatous cells. In addition to reinforcing the organ's architecture, the ECM makes the interchange of molecules among hepatocytes possible, taking place in a semi-continuous flow due to its non-fibrillar composition. This is essential for the maintenance of the differentiated functions of all the cells residing in the liver.
In the fibrotic liver, the components of the ECM are similar to those present in the normal liver (collagen and others), with the exception that they are quantitatively enlarged due to the development of the fibrosis.
The normal structure of the matrix in the subendothelial space is transformed into an interstitial matrix with a high content of fibrillar collagen, product of the paracrine activation of the hepatic stellate cells, induced by the Kupffer cells, with the consequent overexpression and redistribution of the relative quantities of the ECM proteins. These quantities are initially deposited in the portal tract and/or central vein, leading to the development of fibrous connections between the vascular structures and followed by the loss of the fenestrated nature of the sinusoidal endothelium (capillarization), as well as the microvilli of the hepatocytes. This not only has an influence on ECM expansion, but also on the interruption of the normal vascularization of the hepatic lobe, which contributes to the deterioration of the organ's function.3
These changes illustrate the primary role of the ECM in the liver, not only as a frame for its architecture, but also as a continuous network between the cells that makes their constant interchange of signals, through its own receptors, possible.2 Fibrosis, in itself, is an important biologic event, a product of the imbalance between the synthesis and degradation of the ECM molecules. When associated with other processes of the liver, it promotes the long-term development of cirrhosis, which in the absence of opportune and adequate treatment, usually leads to death.
Cirrhosis is the second cause of death at the national level in productive-age individuals in Mexico. This has an important impact on public health, as well as on the economy, implying significant expense resulting from hospitalization, treatment, and absenteeism in the workplace.4
Liver biopsyFor the last 50 years, liver biopsy has been considered the criterion standard for classifying fibrosis because it has enabled physicians to obtain diagnostic information not only about the fibrosis, but also other damaging processes such as necrosis, inflammation, steatosis, and copper and iron deposits, among others.5
Today the Knodell, Ishak, and Metavir scoring systems are the most widely used for evaluating liver biopsy.
Because the conventional biopsy observation reports did not provide clear evaluation criteria that were convincing and conclusive for their statistical analysis, Knodell and his colleagues established the construction of a «histology activity index» (HAI).5
The Knodell method began to be utilized in 1981 with the publication of a document that reported on a histologic procedure developed to quantitatively evaluate alterations produced by chronic hepatitis that included portal inflammation, necrosis, periportal activity, lobular necrosis, and fibrosis. It consists of 4 individually assigned numbers that then make up a single score. The first component (in periportal and/or bridging necrosis) is evaluated on a 0-10 scale. The next 2 components (intralobular degeneration and portal inflammation) are scored on a 0-4 scale. The combination of these 3 markers indicates the quantity of inflammation in the liver. The fourth component indicates the quantity of scarring in the liver and is scored as: F0 (no scarring), F1 (portal fibrosis without septa), F3 (numerous septa without cirrhosis), and F4 (cirrhosis or advanced scarring in the liver).5
The Metavir scoring system has been specially designed for evaluating liver status in persons infected with hepatitis C virus (HCV). The index includes the sum of the scores assigned to the grade of inflammatory activity observed in the sample (0-4, in which 0 is no activity and 3 or 4 is severe activity), in addition to the staging score that represents the quantity of fibrosis: 0 (no scarring), 1 (minimal scarring), 2 (scarring has occurred and extends beyond the areas containing blood vessels), 3 (bridges of fibrosis that are extended to and connected with other fibrotic areas), and 4 (cirrhosis).6
The American Association for the Study of Liver Diseases (AASLD) recommends that «in order for a biopsy to be considered appropriate, it should be taken with a 16 caliber needle, be 2-3cm in length, and contain at least 11 complete portal tracts that enable adequate histologic classification of the parenchyma». However, few percutaneous samples meet these criteria in clinical practice, as shown in a study by Regev et al. published in 2002. They based their analysis on samples of patients with chronic hepatitis C taken from the left and right hepatic lobes and determined that biopsy had a high rate of inter-individual sampling error. They demonstrated histologic grading and staging differences (33.1%) in a large proportion of them, but with uncommon discrepancies in more than one stage or grade.7 This variability increased up to 60.2% in small biopsy samples (1.5cm) and to 86.6% in those of 1cm (p<0.001),8 with a mean difference of 2.4±2.1 for the necroinflammatory activity and 0.6±0.9 for fibrosis, with an r=0.53, p<0.01 and r=0.62, p<0.0001, respectively.9 Other studies have demonstrated a 30% disagreement in the histopathologic staging in relation to the analysis of biopsies taken from the right and left hepatic lobes of patients with nonalcoholic fatty liver disease. Obtaining a sample of adequate size (> 1cm in length with>10 portal tracts)10 greatly reduces sampling error, considering that around 1/50,000 of the hepatic mass is retrieved.11 The article by Regev et al. may not be one of the most outstanding, but it is one of the most cited in recent reviews related to biomarkers.7 They point out the same disadvantage of biopsy, and the authors also coincide on the problem of sampling variability, which should be taken into account when making decisions as to patient treatment and outcome.
Other disadvantages, such as its invasive character, poor sample quality, and tissue size (variation coefficient of 45-35%) make biopsy non-reproducible in relation to length.11 Furthermore, it is a histologic evaluation that strictly depends on the experience of the pathologist (observer error).
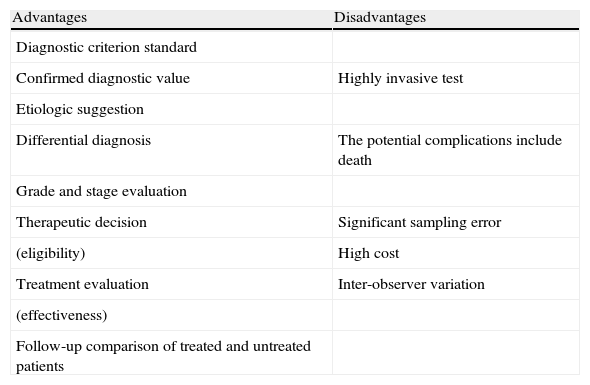
The risks associated with obtaining a liver biopsy range from pain (84%) and hypotension, which are the most frequent, to peritoneal bleeding (0.5%) and damage to the biliary system as the most serious complications. Nevertheless, the level of morbidity and mortality is significantly low (0.09-0.12%),12–15 sustaining the ethical considerations involved in its performance, which prevent the taking of multiple biopsies from the same patient. Finally, these results frequently tend to be representative in relatively advanced disease.16,17 The pros and cons are summarized in Table 1.
Advantages and disadvantages of liver biopsy.
| Advantages | Disadvantages |
| Diagnostic criterion standard | |
| Confirmed diagnostic value | Highly invasive test |
| Etiologic suggestion | |
| Differential diagnosis | The potential complications include death |
| Grade and stage evaluation | |
| Therapeutic decision | Significant sampling error |
| (eligibility) | High cost |
| Treatment evaluation | Inter-observer variation |
| (effectiveness) | |
| Follow-up comparison of treated and untreated patients |
In recent years, there has been increasing interest in identifying and describing hepatic fibrosis through the use of noninvasive markers.18 Fibrosis can be determined in 2 forms (noninvasive); one is based on a biologic approximation (quantification of markers in serum) and the other is a physical approximation (measuring liver stiffness); ultimately, the 2 are complementary.
Hardness is a characteristic property of the hepatic parenchyma, whereas serum markers could indicate, albeit not strictly, an association with the stage of fibrosis.19
Hepatic fibrosis markers offer an attractive and affordable alternative to both the patient and physician. Apart from being noninvasive, there are practically no complications, sampling errors are few or null, and they have the advantage that the measurements can be done repeatedly, thus enabling dynamic disease control. In other words, the fact that the measurements can be carried out repeatedly without affecting the status of the liver (which is not always possible with biopsy) allows the disease progression or regression to be supervised as part of the follow-up, whether in relation to the natural history of the hepatic disease or as the result of treatment regimens.20
The diagnostic value of hepatic fibrosis markers has been explored in numerous studies.
Depending on the clinical and research necessities, the ideal marker should have all of the following characteristics:
- •
High sensitivity and specificity that enable the identification of different stages of fibrosis.
- •
Availability, safety, affordability, and reproducibility.
- •
The capacity to differentiate fibrosis from other hepatic inflammatory disorders, that is to say, avoiding false positives.
Even though there is no ideal fibrosis marker, various molecules or algorithms have been identified as useful indicators, when they are managed in combination.21 Some of the new noninvasive methods have been evaluated through the area under the curve (AUROC) analysis, using biopsy as a reference. Nevertheless, only a few markers show an AUROC>90, allowing them to be regarded as noninvasive markers of choice.
Serum biomarkers have been evaluated mainly in reference to their capacity to determine the stage of the fibrosis. Two types have been proposed: direct biomarkers that reflect the deposit or elimination of the ECM in the liver; and indirect biomarkers, that include the molecules released into the blood, induced by the inflammation, synthetized, and regulated or excreted by the organ, as a product of the commonly altered processes that are a consequence of hepatic function deterioration.22
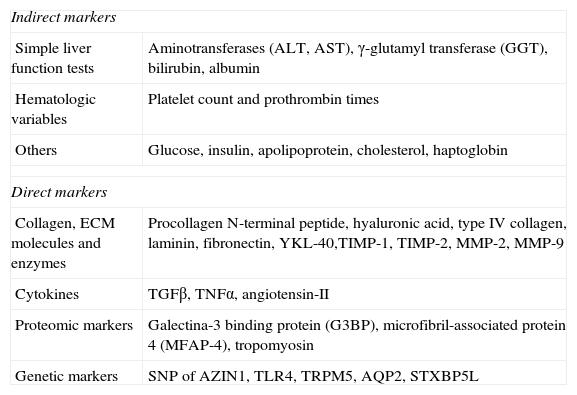
The direct markers presently encompass the different fragments of the ECM components produced by the hepatic stellate cells and other liver cells during the remodeling process of the hepatic matrix;23 these include glycoproteins such as hyaluronic acid (HA), laminin and YKL-40, collagens (pro-collagen III and type IV collagen), and matrix metalloproteases and their inhibitors (TIMPs) (Table 2).
Biomarkers for liver fibrosis.
| Indirect markers | |
| Simple liver function tests | Aminotransferases (ALT, AST), γ-glutamyl transferase (GGT), bilirubin, albumin |
| Hematologic variables | Platelet count and prothrombin times |
| Others | Glucose, insulin, apolipoprotein, cholesterol, haptoglobin |
| Direct markers | |
| Collagen, ECM molecules and enzymes | Procollagen N-terminal peptide, hyaluronic acid, type IV collagen, laminin, fibronectin, YKL-40,TIMP-1, TIMP-2, MMP-2, MMP-9 |
| Cytokines | TGFβ, TNFα, angiotensin-II |
| Proteomic markers | Galectina-3 binding protein (G3BP), microfibril-associated protein 4 (MFAP-4), tropomyosin |
| Genetic markers | SNP of AZIN1, TLR4, TRPM5, AQP2, STXBP5L |
AQP2: aquaporin 2; AZIN1: ornithine decarboxylase antizyme inhibitor; STXBP5L: syntaxin-binding protein 5-like; TLR4: Toll-like receptor 4; TRPM5: long transient receptor potential channel 5.
Modified from Adams et al.36
The so-called indirect markers are determined in routine laboratory tests such as prothrombin times, platelet counts, and transaminase determination (alanine aminotransferase [ALT] and aspartate aminotransferase [AST]) that indicate hepatic alteration.
The most outstanding or novel markers are described below.
Aspartate aminotransferase and alanine aminotransferaseThese are hepatic enzymes excreted into the bloodstream by damaged hepatocytes. The predictive value of the AST/ALT ratio has been validated in nonalcoholic liver disease, chronic viral hepatitis, primary sclerosing cholangitis, and primary biliary cirrhosis.24
In some forms of acute and chronic hepatitis and/or steatosis this ratio is ≤ 1, whereas in alcoholic hepatitis an AST/ALT ratio is often>2. While these proportions are only suggestive of certain hepatic etiologies, there is a superposition between the groups that exclusively depend on the AST/ALT ratio, for example when diagnosing patients with hepatitis C with alcohol abuse. Levels of ALT and AST can also be elevated, although to a lesser degree, due to muscle, kidney, and cardiac problems.25,26 Although this ratio is not significant for detecting fibrosis, it has been reported in cirrhotic patients infected with HCV that an AST/ALT ratio ≥ 1 with sensitivity and specificity values of 81.3% and 55.3%, respectively, during one year of follow-up after cirrhosis diagnosis, combined with a platelet count, can reach positive predictive values of up to 100%.23,27
Platelet countThrombocytopenia is a valuable marker for advanced liver diseases and can be related to mechanisms such as hypersplenism, myelosuppression from HCV, reduced thrombopoietin production, and the development of autoimmune processes. Nevertheless, the joint evaluation of the AST/ALT ratio and platelet count (PLT) has high diagnostic value for cirrhosis (70-90%).27
Prothrombin timeProthrombin time (PT) is an index that reflects the liver's ability to synthesize and therefore is one of the initial indicators of cirrhosis. In a retrospective study conducted on 252 patients infected with HCV, the combination of PT, PLT, and the AST/ALT ratio was predictive of cirrhosis.27 In another study carried out on 518 patients with chronic liver disease, the PTs were correlated with the histologic fibrosis score (r=–0.70, p<0.0001), and a prothrombin index of<80% and<70% was found to be diagnostic for severe fibrosis or cirrhosis, respectively, with a 95% probability.28 Another group reported that PT correlated with the presence and size of esophageal varices.29 PT is a component of different indices.
Procollagen type I carboxy-terminal peptide and procollagen type III amino-terminal peptideType I and type III collagens (fibril formers) are the most abundant in the healthy human liver. In its mature form, collagen integrates into the ECM. During fibrogenesis, the levels of type I collagen can increase up to 8-fold and the I/III ratio also changes, from 1:1 in the healthy liver to 1:2 in the cirrhotic liver.16
The procollagen type III amino-terminal peptide (PIIINP) is an important component of connective tissue; its relative concentration in the basal membrane is greater during hepatic fibrogenesis due to an increase in its serum levels. Its determination for clinical use is limited because of its low sensitivity and specificity (78% and 81%, respectively). In acute hepatitis, PIIINP levels correlate with the aminotransferase levels, reflecting the grade of fibrosis. Unfortunately, it is not specific, given that it is also elevated in acromegaly, pulmonary fibrosis, chronic pancreatitis, and rheumatic diseases.16,19
Procollagen type I carboxy-terminal peptide (PICP) serum levels in patients with mild chronic infection from HCV are not differentiated from those detected in healthy individuals, increasing in only 50% of the patients with advanced or moderate fibrosis and also in those patients with liver cirrhosis; therefore the potential detection of all the cases of fibrosis is not possible through its determination in serum.
Because there is no correlation between serum PICP and PIIINP levels based on their determination in serum, the combined use of both molecules is not reliable for establishing the grade of fibrosis.30
Type IV collagenType IV collagen is an essential component of the hepatic ECM. Unlike the type I and type III collagens that are processed through proteolysis, this molecule is deposited intact in the matrix, and its presence in serum directly reflects its degradation. Thus, in practice, the assays for detecting type IV collagen fragments in serum (NC1 and PIVNP) are more frequently used. They have a positive correlation with the grade of liver fibrosis in patients with chronic viral hepatitis and alcoholic liver disease, functioning as sensitive indicators for the presence of cirrhosis in hemochromatosis. In hepatitis C, the cut-off point for stage F2 diagnosis was established at 110 ng/mL and at 130 ng/mL for predicting stage F3.23,31 The combination of this marker and PIIINP resulted in a sensitivity and specificity of 88%.19
Transforming growth factor-β1Transforming growth factor-β1 (TGF-β1) is a pleiotropic cytokine involved in tissue growth regulation, differentiation, ECM production, and the immune response. Three isoforms of this cytokine (β1, β2, and β3) have been identified, but only β1 has been linked to liver fibrogenesis. TGF-β1 is commonly known as a central component of fibrogenic response in wounds and an over-regulator of different diseases. The correlation between TGF-β1 levels and fibrosis progression is widely accepted.21,32
Hyaluronic acidHyaluronic acid (HA) is a glycosaminoglycan component of the ECM synthesized by the hepatic stellate cells. Under normal circumstances the liver sinusoidal endothelial cells (LSECs) are the structures that directly intervene in its uptake and degradation. High HA levels may be due to its reduced elimination or increased production; they have been detected in the serum of patients with liver diseases of different etiologies, and particularly in those with cirrhosis.23 In a study conducted on patients with nonalcoholic fatty liver disease, HA was selected as the best fibrosis marker, with an AUROC of 0.97 and a specificity and sensitivity of 88-95% and 86-100%, respectively, for this group.19,33 However, its positive predictive value has been reported as lower (61%) than the negative predictive value (98-100%), and thus it was concluded that the principal usefulness of this marker lies in the fact that advanced fibrosis and cirrhosis can be ruled out, depending on its serum level.16
Microfibrillar-associated protein 4Microfibrillar-associated protein 4 is a collagen-binding protein that contains a fibrinogen-like domain in its C-terminal end and an integrin-binding motif in the N-terminal end of the molecule. It participates in the innate immune response and enables the free gaseous interchange in the lungs through its association with the collagen region of surfactant proteins (SP-A and SP-D). The N-terminal region of the protein includes a residual cysteine and an Arg-Gly-Asp (RGD) sequence that is a cellular adhesion motif for various members of the integrin family.34 In a recent study, microfibrillar-associated protein 4 showed highly precise diagnostic serum levels for predicting cirrhosis in a control group (healthy individuals) compared with a group of HCV patients (AUROC=0.97, p<0.0001) with a sensitivity of 91.6% and a specificity of 95.6%,35 as well as in stage F0 compared with F4 (AUROC=0.84, p<0.0001), and in stages F0-F3 versus F4 (AUROC=0.76, p<0.0001).21,36 This protein is also an ideal marker in serum (data to be published) among the liver-specific proteins obtained from our experimental model of fibrosis conducted on rats.
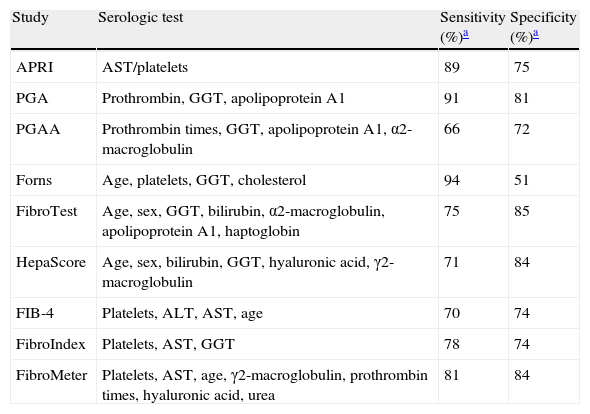
Indirect markers (multi-components)Direct and indirect markers can be used alone or combined to produce composite scores. The calculation of such indices can be relatively simple or can be based on complicated formulas (for example, Fibrotest/Fibrosure);21 the FibroTest (FT, patented by Biopredictive, Paris, France) was the first multi-component test that combined the resulting data from different tests.23,37 Other indices have also been proposed, 4 of which are patented and commercial, and others are being studied. These indices are described in Table 3.
Serologic indices of the multicomponent tests.
| Study | Serologic test | Sensitivity (%)a | Specificity (%)a |
| APRI | AST/platelets | 89 | 75 |
| PGA | Prothrombin, GGT, apolipoprotein A1 | 91 | 81 |
| PGAA | Prothrombin times, GGT, apolipoprotein A1, α2-macroglobulin | 66 | 72 |
| Forns | Age, platelets, GGT, cholesterol | 94 | 51 |
| FibroTest | Age, sex, GGT, bilirubin, α2-macroglobulin, apolipoprotein A1, haptoglobin | 75 | 85 |
| HepaScore | Age, sex, bilirubin, GGT, hyaluronic acid, γ2-macroglobulin | 71 | 84 |
| FIB-4 | Platelets, ALT, AST, age | 70 | 74 |
| FibroIndex | Platelets, AST, GGT | 78 | 74 |
| FibroMeter | Platelets, AST, age, γ2-macroglobulin, prothrombin times, hyaluronic acid, urea | 81 | 84 |
ALT: alanine aminotransferase; AST: aspartate aminotransferase; GGT: γ-glutamyl transferase.
This index combines the measuring of the PT index and γ-glutamyl transferase and apolipoprotein A1 levels. The determination of α2-macroglobulin was added later, resulting in PGAA and improved performance. In chronic liver diseases, the PGA index is related to both inflammation and fibrosis (p<0.01, p<0.05, respectively). However, in general, its precision for detecting cirrhosis is relatively low (66-72%).19,38–40
APRIAPRI is the index resulting from the AST-platelet ratio and is calculated as follows:
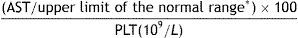
* depends on the reference value of each laboratory.
APRI has been validated in groups of patients with HCV and as a substitute marker of significant liver fibrosis in patients coinfected with HIV/HCV. It has recently been employed to determine advanced fibrosis in patients with HIV;41 however, the result of a meta-analysis suggested that the APRI can identify the hepatitis C-fibrosis ratio with only a moderate degree of precision (63.74%, p<0.01) and with a sensitivity and specificity of 89% and 75%, respectively.42,43
The Forns indexThis index is based on 4 routine clinical variables: age, platelet count, and cholesterol and γ-glutamyl transferase levels. With this method, patients with mild fibrosis (F0-F1) can be differentiated from those with advanced fibrosis (F2-F4), but it is less accurate for distinguishing patients with grades between F2 and F4. The Forns index has been validated in other cohorts as a prediction tool for anti-HCV therapy response, with sensitivity and specificity values of 94% and 51%, respectively, and an AUROC that varies from 0.81-0.86.36,44
HepaScoreThis index combines age and sex with serum concentrations of bilirubin, γ-glutamyl transferase, HA, and γ2-macroglobulin with a score from 0 to 1. In 2 independent studies, one with 512 patients with chronic hepatitis C and the other with 117 patients with hepatitis C, both untreated, the HepaScore showed favorable predictive values for identifying significant fibrosis (AUROC=0.81-0.85), severe fibrosis (AUROC=0.82-0.96), and cirrhosis (AUROC=0.88-0.94). The values obtained varied from: 92% specificity and 67% sensitivity for significant fibrosis, between 81% and 95% for severe fibrosis, and 84% and 71% for cirrhosis. It is important to point out that HepaScore can be automatized using a single analyzer.45,46
FibroTest and FibroSUREThese are identical tests for evaluating fibrosis grade and necroinflammatory activity. They are marketed under different names in Europe and America. The FibroTest (FT) score is obtained by accessing a license from a website and its calculation is based on the age of the patient, sex, and the concentration of serum haptoglobin, α2-macroglobulin, apolipoprotein A1, γ-glutamyl transferase, and bilirubin.47 The score is arrived at with these data and is correlated with the grade of liver damage. Due to the variability of the assay components and the type of analyzers used, the FT can only be carried out in validated laboratories. For the purpose of validating the FT with respect to biopsy, the test was applied to 2,472 untreated patients: 770 with chronic hepatitis C, 723 with hepatitis B, 761 with nonalcoholic fatty liver disease, and 218 with alcoholic liver disease. There was a significant parallelism among them with an intraclass correlation=0.961 (95% CI: 0.948 to 0.970) and 0.899 (95% CI: 0.135 to 0.969) for F4 and F0, respectively. This agreement was maintained according to disease and sex. A faster progression of fibrosis toward F4 (biopsy/FT) was observed in men with nonalcoholic fatty liver disease (1.44/1.62) and a slower one was observed for women (0.09/0.02).48 In a prospective study (2008-2010), 194 patients with HBV underwent liver biopsy, together with FT application and transient elastography (TE), and it was determined that for predicting significant fibrosis (F ≥ 2), severe fibrosis (F ≥ 3), and cirrhosis (F4), the AUROC calculations of the FT were 0.903, 0.907, and 0.866, respectively. According to the cut-off points, 123 patients (63.4%) were correctly classified with respect to histologic fibrosis. The best AUROCs were obtained by multiplying FT (TE×FT) and the results were 0.941, 0.931, and 0.929 for F ≥ 2, F ≥ 3, and F4, respectively.49 This marker's sensitivity and specificity for predicting cirrhosis were 75% and 85%, respectively.
FibroMaxFibroMax is a system that groups 3 different tests together for diagnosing fibrosis (Fibro Test), steatosis (SteatoTest), and nonalcoholic steatohepatitis (NASH Test). Having the results of these 3 assays together on a single sheet provides physicians with a simultaneous and complete estimate of the hepatic lesion associated with nonalcoholic fatty liver disease, combining 10 markers, the patient's age, sex, height and weight, α2-macroglobulin, haptoglobin, apolipoprotein A1, γ-glutamyl transferase, total bilirubin, ALT, AST, total cholesterol, triglycerides, and glucose (fasting).50 There are very few studies that have validated these tests together; one analysis done in Cairo on 44 patients with HCV that correlated histopathology and body mass index through the FibroMax and liver biopsy, showed a significant positive association between body mass index and the SteatoTest through FibroMax, with an AUROC of 0.67, 100% sensitivity, and 99% specificity.51
FibroMeterThe FibroMeter (FM) is a multicomponent assay that combines patient age, platelet count, prothrombin index, AST, γ2 macroglobulin, HA, and ureic nitrogen in blood. FM applicability and performance were validated in the diagnosis of different chronic liver diseases, including chronic HBV and HCV, alcoholic liver disease, and nonalcoholic fatty liver disease. One important characteristic of FM is that it describes the quantity of liver fibrosis in percentage values of fibrotic tissue inside the liver. Another very significant characteristic is that it validates the results through a system that detects erroneous values. FM has 2 main diagnostic aims: to establish the stage of fibrosis that corresponds to the Metavir histologic index and the quantity of fibrosis related to the morphometric determinations of the fibrotic zone.21 The sensitivity and specificity for predicting cirrhosis are 81% and 84%, respectively.
Liver hardness markersPhysicians regularly employ manual palpation to evaluate certain diseases. This method is limited to large, superficial structures that in general are considerably more rigid that the surrounding tissue. For years, research has been carried out on methods designed to visualize the mechanical properties of the tissues, and in contrast to palpation, they have greater sensitivity and specificity.52
One of the recent methods utilized more frequently for estimating liver fibrosis in patients with chronic diseases is the noninvasive liver stiffness measurement. However, there is growing evidence that fibrosis is not the only determining factor in liver stiffness; in fact, inflammation, cholestasis, and congestion could also interfere with its measurement.53
In the methods for visualizing elasticity, there are 2 general approaches for forming the image: 1) the creation of images that reflect the relative differences in tissue stiffness (in other words, images of tension, such as TE) and 2) carrying out reconstructions that are related to the displacement response to the underlying tension, properties of the materials that make the creation of quantitative images of the elasticity possible (for example, ARFI).54
Transient elastographyLiver fibrosis can also be represented by one-dimensional ultrasound (1D) through TE that measures the propagation velocity of the elastic wave by emitting a low frequency (–50Hz) vibration into the liver. This velocity, called elastic modulus (expressed as E=3pv2, in which v is the shear velocity and p is the tissue density) is directly related to tissue stiffness.
The stiffer the tissue, the faster the shear wave is propagated. TE measures the stiffness of the liver in a volume that approximates that of a 1cm wide and 4cm long cylinder, 25-65mm under the surface of the skin. The results are expressed in kilopascals (kPa) with a range of 2.5 to 75kPa, and whose normal value is approximately 5kPa.55 The studies that support the use of TE for quantifying fibrosis have been carried out on patients with hepatitis C and confirmed in patients with hepatitis B. The test correctly classifies cirrhosis in a range from 85% to 94%, but not significant fibrosis with values ranging from 57% to 90%,56 as has been confirmed by meta-analyses (32 articles and 8 abstracts) whose sensitivity and specificity values fluctuate between 0.83 and 0.89 in patients with cirrhosis and 0.79 and 0.78 in patients with significant fibrosis.57
TE is a reproducible noninvasive tool with satisfactory and reproducible accuracy for estimating liver fibrosis and steatosis. Unfortunately, measurements cannot always be made in obese patients and they can have higher results, even at the same stage of liver fibrosis.58 It is important to evaluate liver steatosis, not only because nonalcoholic fatty liver disease is a common hepatic disorder, but also because steatosis frequently coexists with other chronic liver diseases (HCV).59
A new physical parameter has recently been developed for evaluating steatosis based on the properties of ultrasound signals. This controlled attenuation parameter is a measurement of ultrasound attenuation (3.5MHz),60 a physical property of the propagation medium that corresponds to the energy loss in the form of ultrasounds that travel through the medium. In other words, the intensity of the emitted ultrasounds exponentially decreases with depth. In a retrospective study conducted on 115 patients with chronic liver disease of mixed etiology, the controlled attenuation was found to be effective in detecting low-grade steatosis (>10%).58
On the other hand, S and XL probes were developed to attend to different population groups (pediatric and obese). The S probe achieves higher frequencies and shallower measurements under the surface of the skin, which are adapted to constitutionally small pediatric patients.61 The XL probe reaches a lower frequency with a more sensitive transducer, longer length, a broad vibration amplitude, and greater depth under the skin surface. This probe is useful in obese subjects.62
The validation studies for this probe are few, but consistent. One of them includes 286 patients, in whom 92% of the measurements with the XL probe were more reliable than those with the M probe (80%).63 Another study conducted on 193 patients with nonalcoholic fatty liver disease produced reasonable cut-off values for both: 78% for sensitivity and specificity, a positive predictive value of 60%, and a negative predictive value of 89% in F3.64 Further studies are needed to define the adequate cut-off point for XL probe use in different etiologies.
Sudden acoustic radiation force impulsesThe analysis of images obtained through sudden acoustic radiation force impulses (ARFI) is a new technology for carrying out real time liver stiffness measurement. The use of a standard echographic probe provides two-dimensional (2D) elastographic images through a flexible measurement with varying depth, allowing the examination of a specific area.
ARFI mechanically excites tissue using short-lasting acoustic impulses (–262μsec) that propagate, creating displacing shear waves in the tissue that are located on a micro scale. Compared with TE, the shear wave velocity (expressed in meters/sec) measures a very small region (10mm long and 6mm wide) that can be chosen by the operator.52,54
The conventional diagnostic ultrasound images show the differences in the acoustic properties of soft tissues, whereas the ultrasound images based on elasticity represent the differences in their elastic properties (stiffness and viscosity).
The advantage of the formation of images based on elasticity lies in the fact that many soft tissues can share a similar capacity for reflecting ultrasonic waves, but have different mechanical properties that can be employed to clearly visualize the normal anatomy and outline the pathologic lesions.
The elasticity imaging methods are based on the use of acoustic radiation force to transitorily deform the soft tissue, measuring the dynamic displacement tissue response through ultrasounds, using them to estimate the mechanical properties of the tissue.
Both the qualitative images and the quantitative measurements of elasticity can be reconstructed from these data, providing complementary information about disease progression for both diagnostic and longitudinal follow-up purposes.
Preliminary results indicate that the accuracy of ARFI is similar to that of elastography. Nevertheless, the majority of studies are based on small samples of heterogeneous populations and liver biopsy is not always used as a reference.65
Magnetic resonance elastographyOver the last decade, there have been technological advances in the development of magnetic resonance (MR) as a clinical application, focusing on the use of the physiologic and biomechanical properties of human liver tissue for improving the detection of focal and diffuse pathologic conditions, reporting an excellent correlation between stiffness and liver fibrosis.66
Recently, the technique of MR elastography for evaluating the stiffness of different types of tissue has also been described. MR elastography uses a modified phase-contrast technique that is sensitive to the propagation characteristics of the acoustic shear waves that are produced in the organ of interest.67
The technique can be implemented in a conventional MR system with the addition of simple hardware and software. It can be added to a MR examination of the upper abdomen by placing a pneumatic or electromechanical inducer in contact with the abdominal wall of the patient in the supine position. The inducer generates mechanical wave propagation in the liver at frequencies between 40 and 120Hz. The patient need only hold his or her breath for 10-15seconds in order for the images of the wave propagation to be formed in a transverse section of the abdomen.66,68,69
To capture the image of the waves that are propagated in the liver, a contrast-phase MR sequence is used that employs programmed movement gradients that synchronously vary with the applied vibrations, enabling the waves to be easily visualized with amplitudes in the micra range.
Each elastographic acquisition provides an image of the displacement caused by the propagated wave in the medium. The wave images are then processed using an inversion algorithm that is specially developed for generating quantitative images that capture the stiffness of the tissue, called elastograms; when these are taken at the sites of interest in the organ, they provide significant elasticity values. The elasticity unit of measurement is the kPa, the same as in ultrasound-based TE.66 It can very accurately diagnose cirrhosis and its sensitivity and specificity values are 90%.40
In a study conducted on 141 patients analyzed through a double exam (MR elastography and APRI tests), fibrosis stage was evaluated and the results were compared. The conclusion was that liver fibrosis is staged more accurately through MR elastography than with the APRI.70
Biomarker advantages and disadvantagesAs with all diagnostic tests, biomarkers have advantages and disadvantages that can tip the scale for their use as a noninvasive diagnostic and follow-up method.
The obvious advantage of biomarkers over biopsy is that their determination in samples is minimally invasive. Biopsy requires local anesthesia or intravenous analgesia and/or sedation with short-acting benzodiazepines followed by puncture that involves tissue rupture with the possibility of complications, which although infrequent, can be fatal.
That obvious advantage aside, the main quality of the noninvasive method for the clinical prediction of fibrosis over biopsy, in addition to its easy applicability, inter-laboratory reproducibility, and general availability (easy distribution), is that these tests can evaluate the course of the pathophysiologic functions and processes.
An example of this is a study that analyzed the association between the serum levels of the fibrosis markers with the risk for clinical and histologic disease progression. It was conducted on 462 patients infected with HCV that did not respond to pegylated interferon and ribavirin. The evaluation included an initial reference test and annual serum assays of HA, the type III procollagen N-terminal peptide, TIMP-1, and YKL-40. Pretreatment biopsies were taken and all had follow-up at the 2nd and 4th year. The clinical results included decomposition development data, hepatocellular cancer, death, or an increase in the Child-Turcotte-Pugh classification ≥ 7.
The line of reference of HA, YKL-40, and TIMP-1 in the levels combined with other laboratory parameters was significantly associated with the clinical results in 69 patients with disease progression of 15%, p<0.0001. All the baseline levels of the fibrosis markers in serum were significantly associated with histologic fibrosis progression that developed in 70 of the 209 patients with cirrhosis (33%, p<0.0001). However, the HA and platelet counts were better predictors of the histologic progression of fibrosis (AUROC=0.663).71 Therefore, it was concluded that HA had a predictive value for cirrhosis resulting from HCV infection and its serum level correlated with the Child-Pugh score in these patients.56
HA and PIIINP levels independently predict primary biliary cirrhosis progression, whereas laminin values correlate with the Child-Pugh levels of liver cirrhosis, regardless of etiology. For their part, elevated levels of PIIINP and YKL-40 are predictive for a shorter survival in patients with alcohol-induced cirrhosis.23 In relation to fibrosis grade, the serum levels of YKL-40 determined through radioimmunoassay in the serum of 129 patients showed a significant increase in this molecule (p<0.001) in individuals with moderate (466 ug/L) to severe (676 ug/L) fibrosis. YKL-40 was also increased (p=0.018) in subjects with mild fibrosis (270 ug/L).23
A retrospective French study of 1,457 patients with HCV compared the capacity of different noninvasive methods (FT, APRI, FIB-4, and TE) to predict the grade of survival and death related to liver damage. The FT results produced high predictive values for a period of up to 5 years, and they did not vary after being adjusted based on treatment response, patient age, or the estimated necroinflammatory grades.53 In general terms, the use of these noninvasive methods is an alternative to the use of traditionally accepted biopsy, especially in the European countries.
Currently, the following are among the main disadvantages of biomarkers: 1) none of them is liver-specific, 2) their results can be influenced by comorbid conditions, and 3) they require critical interpretation.
The FibroTest and HepaScore produce false positives in patients with Gilbert's syndrome and with hyperbilirubinemia due to the presence of hemolysis in the serum.72
Likewise, acute hepatitis can produce false positives in the APRI tests, Forns index, or FibroMeter, because they all measure the levels of aminotransferases and these are also higher in non-fibrosing liver diseases.
On the other hand, the serum levels of the marker depend on the level of elimination of the molecule, which is influenced by hepatic endothelial cell dysfunction and the deterioration of biliary or renal excretion. These levels reflect not only the ECM deposit, but also the amount of hepatic matrix turnover and they have the tendency to be higher when there is great inflammatory activity. As a consequence, the matrix deposit may not be detected when there is minimal inflammation.23
Another disadvantage is that biomarker evaluation is limited to a specific pathologic condition (for example, alcoholic liver disease) and its performance is compared with that of one or more panels, therefore it is difficult to know the exact contribution of a recently described marker.73
At present we can say that one of the main disadvantages observed in these types of tests is the discordance between sensitivity and specificity, which so far has made it impossible to choose one with unerring results for any type or grade of fibrotic disease.
The sensitivity or specificity variations should be expected every time some characteristic of the patient or disease influences the results of the test, due to a predictable physiologic or biologic phenomenon.74,75
Finally, another of the big disadvantages is that the majority of these markers can only detect either very early or advanced stages of disease, with a clear inability to distinguish the intermediate stages.
In reference to the physical methods, we can say that the main advantage of ARFI is its easy implementation into a modified commercial ultrasound machine (Acuson 2000 Virtual Touch Tissue Quantification; Siemens Healthcare, Erlangen, Germany). Nevertheless, unlike TE values, ARFI values have a narrow margin (0.5 to 4.4 m/sec). This particularity limits the cut-off values for deciding the classification of the patients.19,21
In theory, the advantages of MR elastography include its capacity to analyze almost the entire liver and its applicability in patients presenting with obesity or ascites. However, MR elastography cannot be carried out in the livers of patients with iron overload, due to the limitations caused by signal-noise. It is also very expensive and requires a long period of routine practice.66
On the other hand, TE has the advantage of being a short procedure (< 5min) that gives immediate results. The procedure is very easy to learn, but accurate results require: careful interpretation, a success rate (the ratio of valid measurements to the total number of measurements) of over 60%, and an interquartile range (IQR) that reflects the variations between measurements under 30% of the value of the median (IQR/M, 30%).76
TE is not recommended in patients presenting with obesity and ascites because these conditions make it difficult to obtain good results. Abnormalities of tissue with edema, inflammation due to extra-hepatic cholestasis, or congestion have also been observed to interfere with the measurement of liver stiffness, regardless of fibrosis; the influence of steatosis is still a subject of debate.77
The only technology that currently competes with ultrasound elastography is MR elastography, because it is not limited by the presence of bone or gas and is sensitive to 3-dimensional movement; it has high velocity volume acquisition, can be performed by relatively inexperienced practitioners, and result interpretation is very simple.78
Ultrasound evaluation of soft tissue tension and elasticity is generally more competitive than MR assessment, there is easier access to a scanner for patients and practitioners, and the general cost per study is much lower.
Advances and perspectivesThe search for new markers produced a wide variety of candidates, but their numbers decreased as they were meticulously evaluated in order to meet the necessary requirements for this type of test. In contrast to existing noninvasive predictor panels, the number of samples and controls for marker validation is an important technical challenge, as is estimating the relative value of the novel biological markers.
The performance of each biomarker is compared with the benefit or benefits of one or more panels and its evaluation is limited to one pathologic condition (for example, alcoholic liver disease). Therefore the exact contribution of each newly described biomarker is difficult to determine.73
The appearance of new technologies such as proteomics that evaluates patterns of proteins or glycoproteins through mass spectroscopy using serum samples has shown limited applicability because it is unable to distinguish the etiology of pathologies that are not liver diseases.
For example, in 2004 Callewaert et al. developed a study based on the presence of total N-glycosylated proteins (GlycoCirrhoTest and GlycoFibro Test) with the serum of patients presenting with chronic liver disease. The attempt to distinguish cirrhosis through the combination of the 2 tests produced a sensitivity of 79% and a specificity of 86%.79 On the other hand, the same modifications in the serum proteins (glycosylation) continuously appear in all liver diseases,80 thus it is necessary to broaden prospective studies in order to determine the clinical application of these techniques. FastLec-Hepa is an accurate system that can evaluate the treatment of patients with HCV; it is based on an immunoassay that detects hyperglycosylation of the Mac-2 binding protein (M2BP) and is sensitive and quantitative for calculating the therapeutic effects of α-PEG-interferon and ribavirin within a short post-therapeutic interval. Fibrosis progression is equivalent to –0.30 stages per year, in patients with sustained viral response and 0.01 stages per year in patients with recurrence or non-responders. FastLec-Hepa is currently available for indirectly evaluating the existing correlation between the therapy and the glycosylation quantification of this protein activated during fibro-proliferative diseases, even though it was not specifically developed for that purpose.81
Phosphoproteomics can improve the understanding of liver fibrosis pathogeny, using the phosphorylated profiles of the proteins that participate in the signaling pathways of this process, as demonstrated by Younossi et al.82 Their results suggest that the phosphoprotein biomarkers could potentially be used in a clinical environment for identifying patients presenting with nonalcoholic steatohepatitis; it provides information about the metabolic pathways that may be involved in the pathogeny of the disease.
In summary, despite the emergence of new technologies, the acquired protein patterns, whether obtained by glycosylation or fucosylation, have problems differentiating both the stage and specificity of fibrosis.
Moreover, due to the difficulty in evaluating each of these markers, their statistical comparison has been recurred to, as reported in the most recent analysis of 172 studies evaluating the diagnostic accuracy of fibrosis and cirrhosis markers. The results for fibrosis were: the probability quotients of cut-off points of 5-10 had positive medians and AUROC (0.71 to 0.86) for platelet count, APRI, FibroIndex, FibroTest, and the Forns index; and for cirrhosis they were: AUROC (0.80 a 0.91) for platelet count, APRI, and HepaScore. The authors state that the main difficulty for carrying out these types of studies is the lack of methodological description and the limited interpretation of the liver biopsy, as well as insufficient inclusion methods.83
Conclusions and discussionThe successful management of chronic liver disease treatment depends on the correct staging of fibrosis. Noninvasive reproducible tests are necessary for providing the means for disease diagnosis and follow-up, and therapeutic response. The process of fibrogenesis is a common response of the liver when there is a chronic lesion produced by a variety of aggressions as part of disease development,3 and has made the adequate search for specific biomarkers difficult, becoming a challenge in translational hepatology.
A series of noninvasive techniques are being developed, ranging from serum assays to image acquisition. FibroScan and elastometry are among the most successful noninvasive methods, as well as those based on serologic assays such as APRI and FibroTest.19 There are other tests that are promising, but they have not yet been validated. In addition to including a large number of patients, validation should also encompass other important factors, such as body mass index, ethnicity, and liver disease etiology.73
It is important to point out that the majority of noninvasive tests are not able to accurately differentiate the early stages of fibrosis. In fact, most of these tests mainly identify cirrhosis with minimal fibrosis. At present the noninvasive tests for diagnosing significant fibrosis (F>2) cannot substitute biopsy. Therefore, the present usefulness of noninvasive diagnosis is still limited because it only allows the physician to reduce the population of patients that are candidates for liver biopsy.
Financial disclosureThis work was funded by the UNAM-PAPIIT IN-205210, UNAM-PAPIIT IT-201213, and SEP-CONACYT 84837 grants.
Conflict of interestThe authors declare that they have no conflict of interest.
The authors wish to thank Dr. Rubén D. Martínez, Dr. Jaime Berúmen Campos, Dr. Julio César Carrero Sánchez, and Dr. Max Julio Schmulson Wasserman for their comments pertaining to the elaboration of this article.
Please cite this article as: Cequera A, García de León Méndez MC. Biomarcadores para fibrosis hepática, avances, ventajas y desventajas. Revista de Gastroenterología de México. 2014;79:187–199.

