To evaluate total serum calcium (TC) and albumin-corrected calcium (ACC) as prognostic severity factors in acute pancreatitis (AP).
MethodsNinety-six patients were included in the study. They were diagnosed with AP and admitted to the Hospital Regional de Veracruz within the time frame of January 2010 to December 2012. AP severity was determined through the updated Atlanta Classification (2013). TC and ACC values were measured in the first 24hours of admittance and the percentages of sensitivity (S), specificity (Sp), positive predictive value (PPV), negative predictive value (NPV), positive likelihood ratio (LR+), and negative likelihood ratio (LR-) were calculated through ROC curves and contingency tables.
ResultsIn accordance with the updated Atlanta Classification, 70 patients presented with mild AP, 17 with moderately severe AP, and 9 with severe AP. Of the patient total, 61.5% were women, and 69.8% presented with biliary etiology. The maximum TC cut-off point was 7.5mg/dL, with values of S, 67%; Sp, 82%; PPV, 27%, and NPV, 96%. The maximum ACC cut-off point was 7.5mg/dL, with values of S, 67%; Sp, 90%; PPV, 40%; NPV, 96%. Both had values similar to those of the Ranson and APACHE II prognostic scales.
ConclusionsTC and ACC, measured within the first 24hours, are useful severity predictors in acute pancreatitis, with sensitivity and predictive values comparable or superior to those of the conventional prognostic scales.
Evaluar el calcio sérico total (CT) y el calcio corregido por albúmina (CCA) como factores pronósticos de severidad en pancreatitis aguda (PA).
MétodosSe incluyó a 96 pacientes con diagnóstico de PA ingresados de enero del 2010 a diciembre del 2012 en el Hospital Regional de Veracruz. La severidad de la PA se determinó utilizando la Clasificación de Atlanta actualizada (2013). Se recolectaron los valores de CT y CCA en las primeras 24 h a partir del ingreso y se calcularon los porcentajes de sensibilidad (S), especificidad (E), valores predictivos positivo y negativo (VPP y VPN) y razones de verosimilitud (RVP y PVN) por medio de curvas ROC y tablas de contingencia.
ResultadosDe acuerdo con los criterios de la Clasificación de Atlanta actualizada, 70 pacientes presentaron PA leve, 17 PA moderadamente grave y 9 PA grave. Del total de pacientes, 61.5% fueron mujeres, y el 69.8% presentó etiología biliar. El CT tuvo un punto de corte óptimo de 7.5mg/dl, con valores de S, 67%; E, 82%; VPP, 27% y VPN, 96%. El CCA tuvo un punto de corte óptimo de 7.5mg/dl, con valores de S 67%; E, 90%; VPP, 40%; VPN, 96%. Ambos obtuvieron valores similares a los de las escalas pronósticas de Ranson y APACHE II.
ConclusionesEl CT y CCA tomados en las primeras 24 h son útiles como predictores de severidad en pancreatitis aguda, con valores de S y predictivos comparables o superiores a los de las escalas pronósticas tradicionales.
Acute pancreatitis (AP) is an acute inflammatory process of the pancreas that affects other regional tissues and more distant organ systems in a variety of ways.1 Histologically it is characterized by acinar cell necrosis and the presence of inflammatory infiltrate in the parenchyma.2 Every year there are between 5 and 80 new cases per 100,000 inhabitants.3 In the last decade, in the U.S. and in Europe, a decrease in the number of fatal cases and a noticeable increase in hospitalizations due to AP, specifically those related to biliary etiology, have been reported.4
The general consensus is that 2 of the following 3 characteristics are necessary for making AP diagnosis: intense epigastric pain, a serum amylase or lipase concentration 3 times higher than the normal limit, and characteristic AP findings through computed tomography.5 The clinical course varies significantly from person to person. Although it is generally self-limited, through the AP classification criteria from 1992, it has been determined that on average, 20% of the patients present with severe disease, with a mortality rate of 50%.6,7 The use of prognostic scales enables severe cases to be detected and opportune and adequate management to be established.8 The most widely used are the Ranson and APACHE-II scores5,9,10 and the Balthazar computed tomography severity index. 11 Biochemical markers have also turned out to be useful predictors. Examples of some of them are: C-reactive protein, procalcitonin, interleukin-6, thioredoxin-1, and polymorphonuclear elastase. 6,12–14
Hypocalcemia has been associated with AP severity but its etiopathogenesis has been a subject of debate for decades. Centuries-old literature reported that in 1890 Langerhans observed calcium deposits in areas of fat necrosis. Later Edmondson, in 1944, postulated that hypocalcemia was due to the formation of calcium soaps. 15 In 1975, Condon et al. reported on the increase in parathyroid hormone in patients with hypocalcemia and normocalcemia and suggested that parathyroid hormone depletion was the main induction factor of persistent hypocalcemia in AP.16 In 1976, Imrie et al. associated hypocalcemia with hypoalbuminemia and proposed that total serum calcium (TC) should be corrected in accordance with albumin concentration before taking therapeutic measures.17 AP studies using animal experimental models have shown that ionized calcium and total calcium concentrations decrease 6 to 18h after pancreatitis induction, in addition to the fact that the onset of hypocalcemia is associated with the accumulation of calcium in the soft tissues.18,19 More recently, the role of the parathyroid hormone has been taken up again in relation to the pathogenesis of hypocalcemia in AP, and it has been postulated that the condition is the result of an inadequate parathyroid response; it is even probable that, just as in other critical diseases, its origin is multifactorial.20–23Given its importance, TC has a place in some of the AP prognostic severity scales. 10,24 Individually, it has been evaluated as a mortality prognostic factor 25,26 and it has also been evaluated as a predictor of severe AP with infection.27 Albumin-corrected calcium (ACC) has also been associated with severity,28,29 but we have not found studies that evaluate it as a prognostic severity factor within the first 24h of the patient's hospital admittance.
Due to the availability of TC determination tests in secondary care health centers in Mexico, we feel that TC and ACC can be used as easily accessible AP severity tests in the Mexican health system. Therefore the aim of the present study was to evaluate TC and ACC as prognostic severity markers in AP.
MethodsThis study was conducted on patients that were admitted to the Hospital Regional de Veracruz within the time frame of January 2010 and December 2012 that were diagnosed with first-time AP and who were admitted within 72h of the onset of epigastric pain. All patients under 18 years of age, patients whose management was not completed at our hospital, and those whose medical records were incomplete were excluded from the study. The following clinical and demographic data were collected from the medical records: sex, age, previous history of pancreatitis, pathologic history, TC taken 24h after admission, serum albumin, amylase and lipase, Ranson and APACHE-II scores, and imaging and computed tomography data in the cases of patients with severe or moderately severe AP.
AP diagnosis was made based on the American College of Gastroenterology recommendations, and the presence of 2 of the 3 following characteristics was established: intense epigastric pain, serum amylase or lipase ≥ 3 times above the normal limit, and characteristic AP findings in the CT images.5,30 The patients were classified into 3 groups in accordance with the revised Atlanta Classification (published in 2013): severe AP (associated with persistent organ failure longer than 48h with or without local or systemic complications), moderately severe AP (that presents with local or systemic complications, with no persistent organ failure), and mild AP (with no organ failure or local or systemic complications).30
In order to evaluate TC and ACC as prognostic factors of severity, the lowest TC values were collected within the first 24h of hospital admittance. These values were then corrected according to the serum albumin level (see formula), thus obtaining the ACC. 31ACC=TC + (0.8 * [4 – serum albumin concentration])
Data analysisData were analyzed through descriptive statistics to determine the general population characteristics. The one-way ANOVA, the Kruskal-Wallis test, and the chi-square test were employed to establish the statistical significance of the differences between groups, according to the characteristics of the analyzed variables. Statistical significance was determined with a p<0.05. ROC curves were used in order to establish the possible cut-off values for TC and ACC. The maximum cut-off value was utilized to calculate the sensitivity (S), specificity (Sp), positive predictive value (PPV), negative predictive value (NPV), positive likelihood ratio (PLR), and negative likelihood ratio (NLR) of each criterion by means of contingency tables. For comparison purposes, the same values were calculated for the Ranson prognostic tests 48h after admission and the APACHE-II prognostic test upon hospital admission. Odds ratio (OR) was employed to evaluate the cut-off values as relative risks for developing severe pancreatitis. All the statistical analyses were done using the IBMTM SPSSTM 19 program.
Ethical aspectsThe study was approved by the Research and Ethics Committee of the Hospital Regional de Veracruz in strict adherence to the 2008 revised Declaration of Helsinki and the General Health Law in matters of Health Research, Second Title, Chapter I, Article 17, Section I, negligible risk research. There was no harm to patients, given that the data were collected retrospectively from medical records. All the necessary precautions were taken to safeguard patient data confidentiality, allowing the medical records and databases to be used only by the researchers, utilizing a consecutive code to identify them that had no relation to the corresponding medical record number or to the initials of the patients’ names.
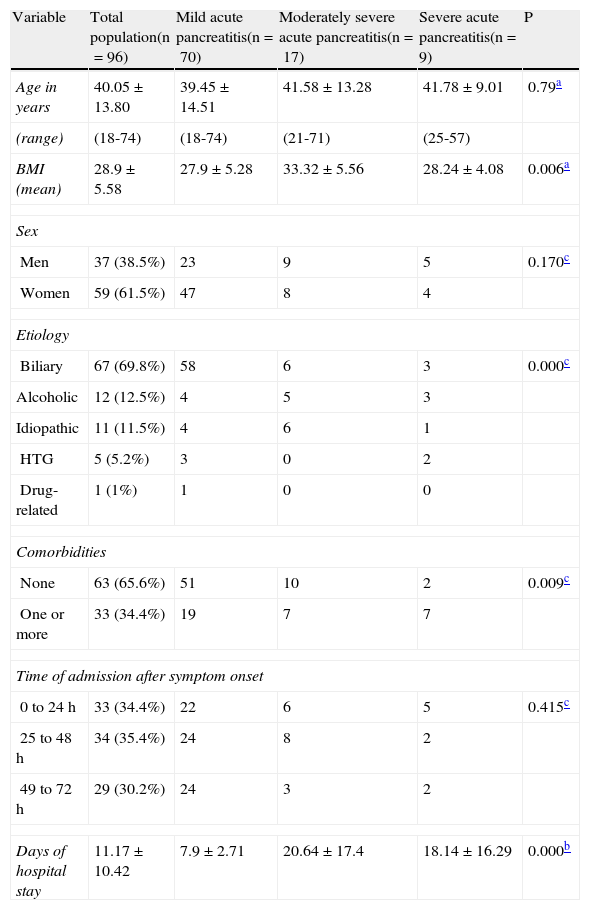
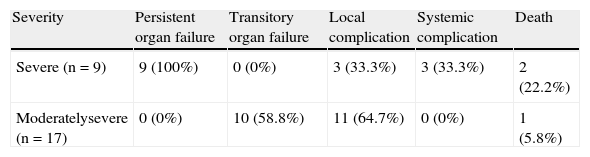
ResultsWithin the study time frame, the medical records of 96 patients met the inclusion criteria, 70 (72.9%) of which presented with mild AP, 17 (17.9%) with moderately severe AP, and 9 (9.4%) with severe AP. No significant difference was observed in the mean age (mild AP 39.45±14.51 years, moderately severe AP 41.58±13.28 years, severe AP 41.78±9.01 years; ANOVA, p=0.759) or in sex distribution (chi-square, p=0.170) among the 3 groups. Of the patient total, 61.5% were women and 38.5% were men. Biliary etiology was the most frequent, representing 69.8% of the cases. Of the patient total, only 3 (3.1%) died, 2 of which had severe AP (both died in the early phase) and one had moderately severe AP (and died in the late phase). The rest of the general patient characteristics are detailed in Table 1 and their complications in Table 2.
General characteristics of the patients with acute pancreatitis.
| Variable | Total population(n=96) | Mild acute pancreatitis(n=70) | Moderately severe acute pancreatitis(n=17) | Severe acute pancreatitis(n=9) | P |
| Age in years | 40.05±13.80 | 39.45±14.51 | 41.58±13.28 | 41.78±9.01 | 0.79a |
| (range) | (18-74) | (18-74) | (21-71) | (25-57) | |
| BMI (mean) | 28.9±5.58 | 27.9±5.28 | 33.32±5.56 | 28.24±4.08 | 0.006a |
| Sex | |||||
| Men | 37 (38.5%) | 23 | 9 | 5 | 0.170c |
| Women | 59 (61.5%) | 47 | 8 | 4 | |
| Etiology | |||||
| Biliary | 67 (69.8%) | 58 | 6 | 3 | 0.000c |
| Alcoholic | 12 (12.5%) | 4 | 5 | 3 | |
| Idiopathic | 11 (11.5%) | 4 | 6 | 1 | |
| HTG | 5 (5.2%) | 3 | 0 | 2 | |
| Drug-related | 1 (1%) | 1 | 0 | 0 | |
| Comorbidities | |||||
| None | 63 (65.6%) | 51 | 10 | 2 | 0.009c |
| One or more | 33 (34.4%) | 19 | 7 | 7 | |
| Time of admission after symptom onset | |||||
| 0 to 24 h | 33 (34.4%) | 22 | 6 | 5 | 0.415c |
| 25 to 48 h | 34 (35.4%) | 24 | 8 | 2 | |
| 49 to 72 h | 29 (30.2%) | 24 | 3 | 2 | |
| Days of hospital stay | 11.17±10.42 | 7.9±2.71 | 20.64±17.4 | 18.14±16.29 | 0.000b |
Source: Direct.
Complications that presented in patients with moderately severe and severe acute pancreatitis.
| Severity | Persistent organ failure | Transitory organ failure | Local complication | Systemic complication | Death |
| Severe (n=9) | 9 (100%) | 0 (0%) | 3 (33.3%) | 3 (33.3%) | 2 (22.2%) |
| Moderatelysevere (n=17) | 0 (0%) | 10 (58.8%) | 11 (64.7%) | 0 (0%) | 1 (5.8%) |
Source: Direct.
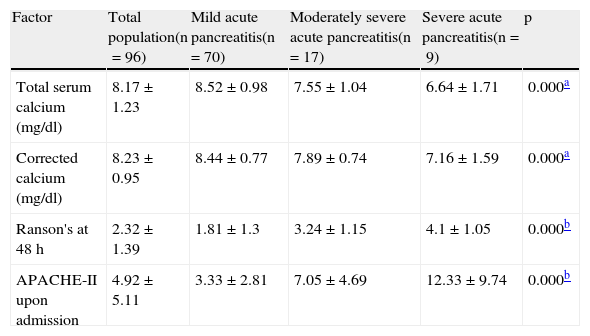
The one-way ANOVA test with the Tukey-B post hoc test showed significant differences in the TC concentration of the patients in the 3 groups (p=0.000; see Table 3). The mean ACC was also significantly lower in the patients presenting with severe and moderately severe AP, compared with the mild AP patients (p=0.000; Table 3). The Ranson (p=0.000) and APACHE-II (p=0.000) scores were significantly higher in the patients with severe and moderately severe AP than in those with mild AP. Because the scores of these 2 scales were not normally distributed, they were analyzed using the Kruskal-Wallis test and the group comparisons were made using the Mann-Whitney U test (Table 3).
Mean values of the prognostic severity factors in acute pancreatitis.
| Factor | Total population(n=96) | Mild acute pancreatitis(n=70) | Moderately severe acute pancreatitis(n=17) | Severe acute pancreatitis(n=9) | p |
| Total serum calcium (mg/dl) | 8.17±1.23 | 8.52±0.98 | 7.55±1.04 | 6.64±1.71 | 0.000a |
| Corrected calcium (mg/dl) | 8.23±0.95 | 8.44±0.77 | 7.89±0.74 | 7.16±1.59 | 0.000a |
| Ranson's at 48 h | 2.32±1.39 | 1.81±1.3 | 3.24±1.15 | 4.1±1.05 | 0.000b |
| APACHE-II upon admission | 4.92±5.11 | 3.33±2.81 | 7.05±4.69 | 12.33±9.74 | 0.000b |
Source: Direct.
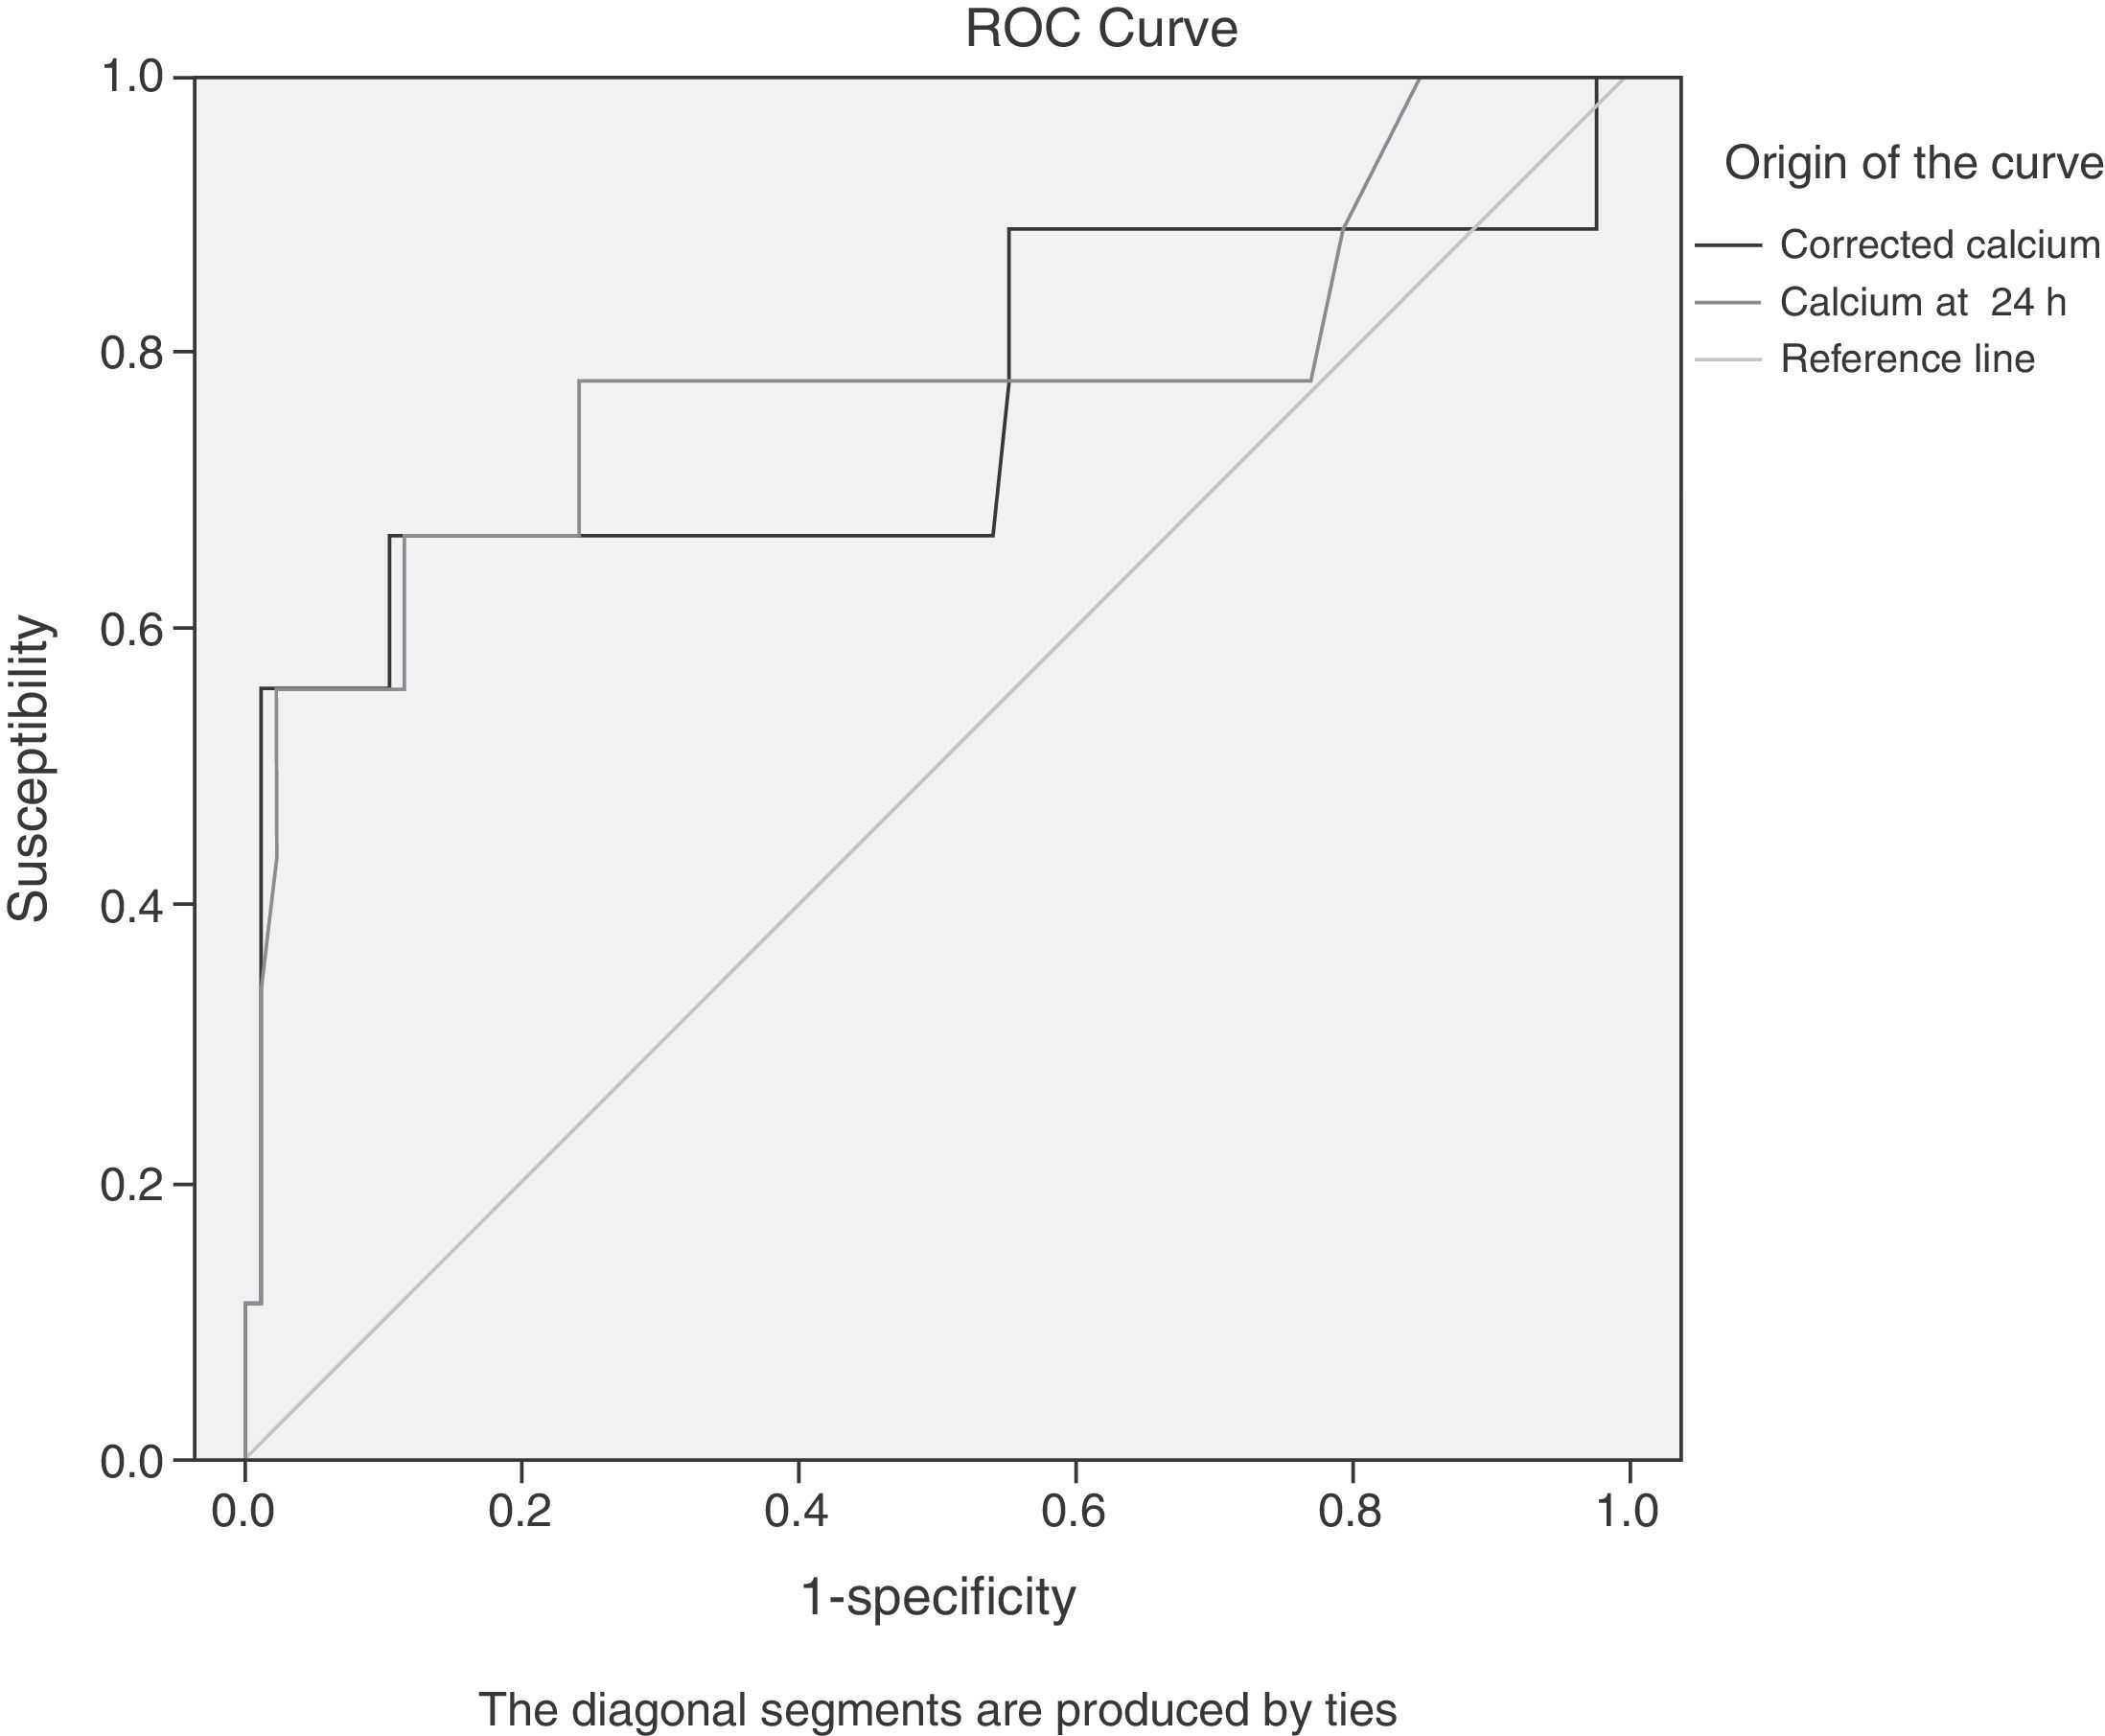
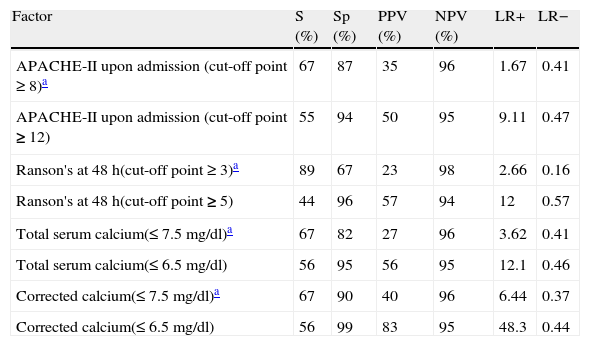
The results of the analysis with ROC curves showed that the maximum cut-off value (with a better compromise between S and Sp, see figure 1) for both TC and ACC was 7.5mg/dl. The same cut-off values for S and Sp were obtained through the contingency table analysis, confirming the ROC curve results. The results of the S, Sp, predictive values, and likelihood ratios for TC were: S, 67%; Sp, 82%; PPV, 27%; NPV, 96%; LR+, 3.62; and LR-, 0.41, and the values found for ACC were: S, 67%; Sp, 90%; PPV, 40%; NPV, 96%; LR+, 6.44; and LR-, 0.37.
 and ACC (albumin-corrected calcium) in the first 24h from hospital admission for predicting severe AP. The maximum cut-off point for both is 7.5mg/dl. The area under the curve (AUC) for TC (light grey) is 0.775 (95%CI, 0.565-0.985); the AUC for ACC (dark grey) is 0.753 (95%CI, 0.530-0.975).")
ROC curves of the TC values (total serum calcium) and ACC (albumin-corrected calcium) in the first 24h from hospital admission for predicting severe AP. The maximum cut-off point for both is 7.5mg/dl. The area under the curve (AUC) for TC (light grey) is 0.775 (95%CI, 0.565-0.985); the AUC for ACC (dark grey) is 0.753 (95%CI, 0.530-0.975).
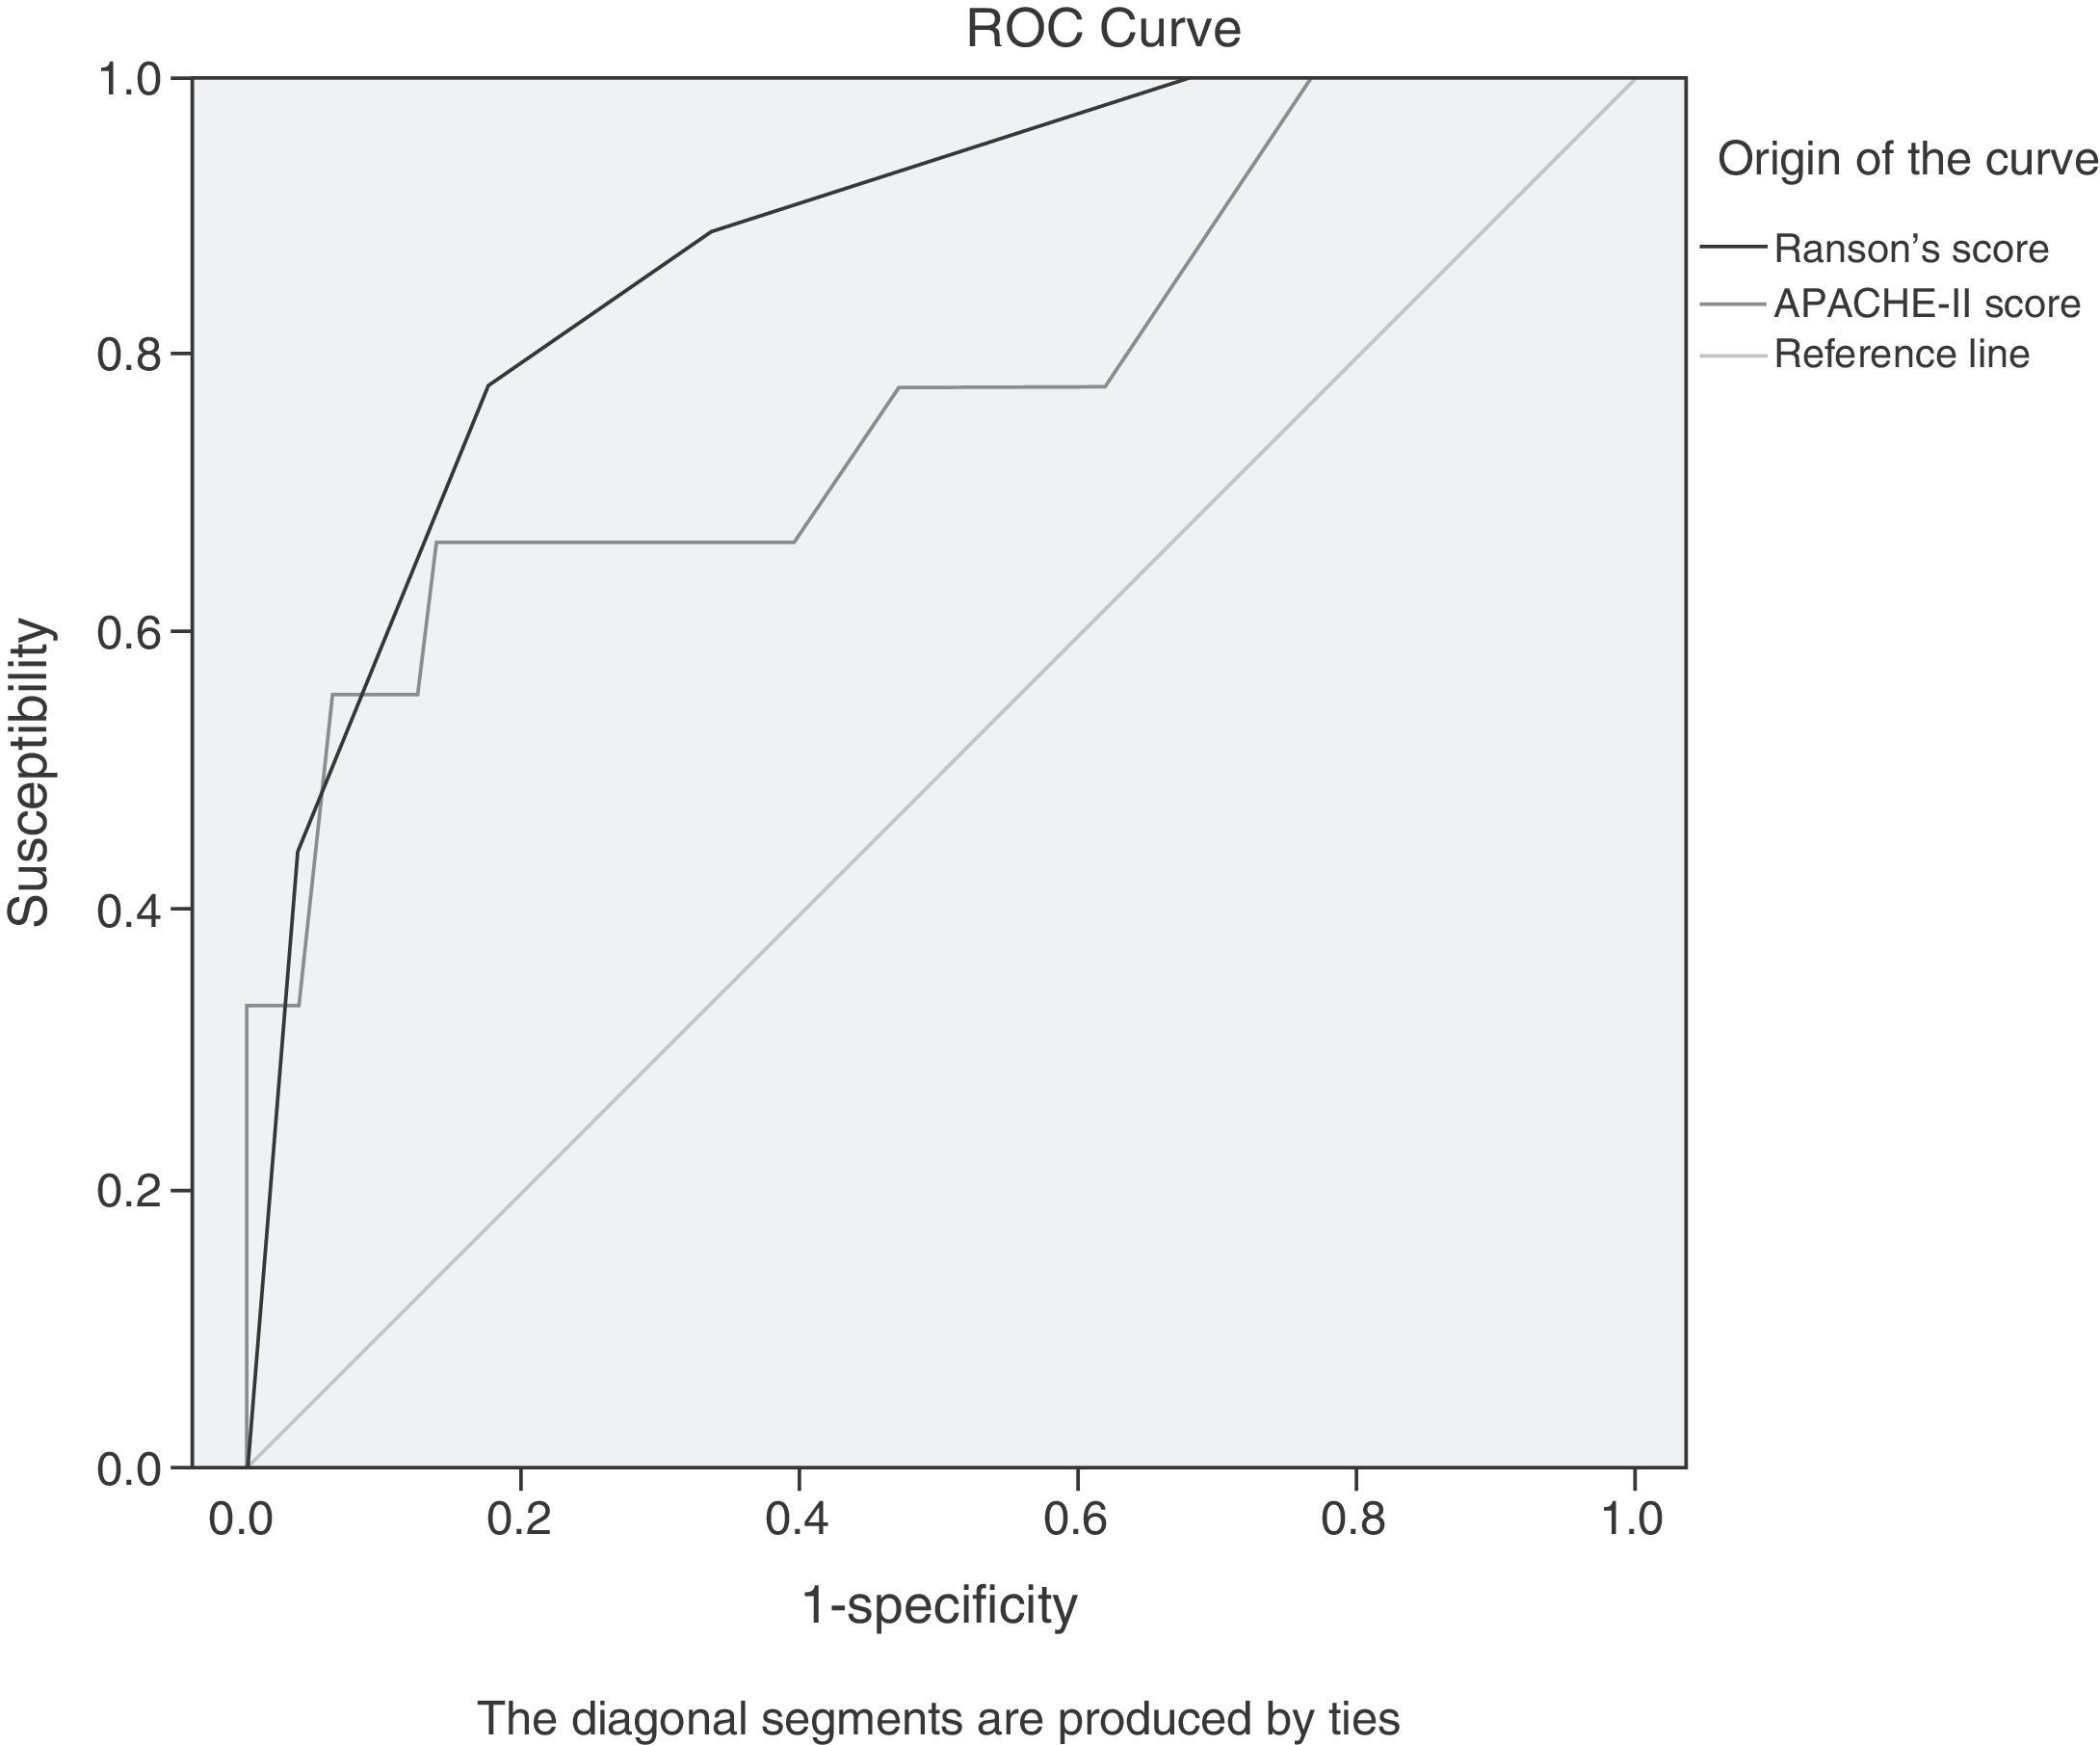
For comparative purposes, values corresponding to the APACHE-II and Ranson scores were obtained. Due to the change of the classification system, it was necessary to do the ROC curve analysis and contingency tables to determine the maximum cut-off points for these 2 diagnostic scales. The cut-off points coincided with those reported in the literature before the classification system change,6,9,10,12 and they were: Ranson's score 3, APACHE-II score 8 (fig. 2).
 is 0.773 (95%CI, 0.585-0.961); the AUC for the Ranson's score (dark grey) is 0.872 (95%CI, 0.760-0.985).")
ROC curves of the APACHE-II score values upon admission and the Ranson's score value at 48h for predicting severe AP. The maximum cut-off points are 8 for the APACHE-II score and 3 for the Ranson's score. The area under the curve for the APACHE-II score (light grey) is 0.773 (95%CI, 0.585-0.961); the AUC for the Ranson's score (dark grey) is 0.872 (95%CI, 0.760-0.985).
The values obtained for these prognostic criteria are detailed in Table 4. It is worth noting that when the maximum cut-off points (highlighted in black) are taken into consideration, the ACC predictive value at 7.5mg/dl is the highest of the 4 criteria, and the TC predictive value is very similar to the Ranson and APACHE-II scores. This table also shows the values corresponding to the sub-maximum cut-off points (stricter, not highlighted) for each criterion. When the sample patients had TC and ACC values under the maximum cut-off point (7.5mg/dl), the relative risk for developing severe AP rose significantly. The OR for TC was 8.87 (95%CI: 2 - 39.3; p=0.002); and for ACC was 17.33 (95%CI: 3.69 - 81.5; p<0.000).
Sensitivity, specificity, predictive values, and likelihood ratios of the factors analyzed for predicting progression to severe acute pancreatitis.
| Factor | S (%) | Sp (%) | PPV (%) | NPV (%) | LR+ | LR− |
| APACHE-II upon admission (cut-off point ≥ 8)a | 67 | 87 | 35 | 96 | 1.67 | 0.41 |
| APACHE-II upon admission (cut-off point ≥ 12) | 55 | 94 | 50 | 95 | 9.11 | 0.47 |
| Ranson's at 48 h(cut-off point ≥ 3)a | 89 | 67 | 23 | 98 | 2.66 | 0.16 |
| Ranson's at 48 h(cut-off point ≥ 5) | 44 | 96 | 57 | 94 | 12 | 0.57 |
| Total serum calcium(≤ 7.5 mg/dl)a | 67 | 82 | 27 | 96 | 3.62 | 0.41 |
| Total serum calcium(≤ 6.5 mg/dl) | 56 | 95 | 56 | 95 | 12.1 | 0.46 |
| Corrected calcium(≤ 7.5 mg/dl)a | 67 | 90 | 40 | 96 | 6.44 | 0.37 |
| Corrected calcium(≤ 6.5 mg/dl) | 56 | 99 | 83 | 95 | 48.3 | 0.44 |
S: sensitivity; Sp: specificity; PPV: positive predictive value; NPV: negative predictive value; LR+: positive likelihood ratio; LR-: negative likelihood ratio.
Source: Direct.
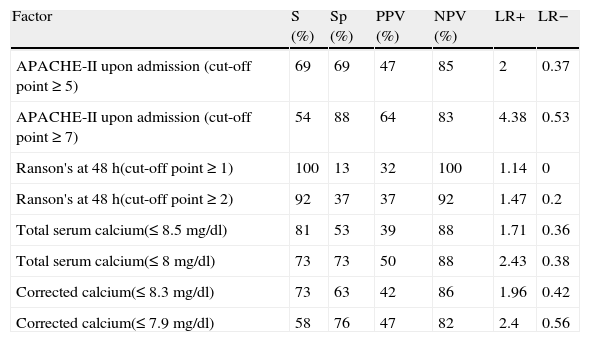
The fact that the definitive diagnosis of AP severity depends on the duration of associated organ failure complicates making an early prediction of whether the patients will finally present with severe or moderately severe AP. Our approach to the problem was to put the patients with moderately severe AP and severe AP together in one group. In this manner, we had a group of 26 patients that was utilized to determine the maximum cut-off points for this condition and for the 4 prognostic factors through contingency tables. In the end, each cut-off point was analyzed through OR to determine the relative risk for presenting with severe AP and moderately severe AP, separately.
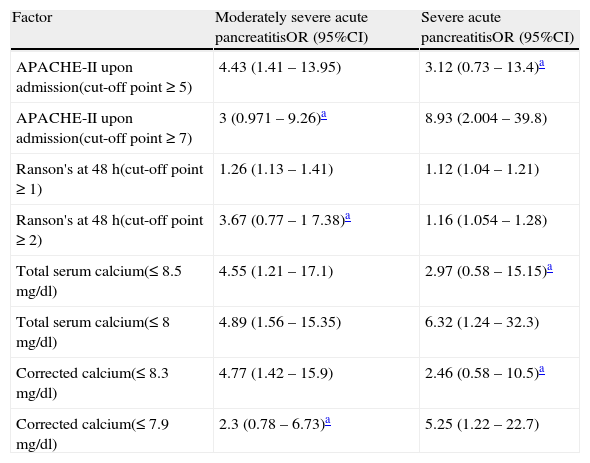
The results of this procedure are shown in Tables 5 and 6. Table 5 displays the maximum cut-off points for predicting whether the patient will present with severe or moderately severe AP, without excluding either possibility. In addition, the cut-off points in which the patient has a greater risk for progressing to severe AP are included.Table 6 details the relative risk for progressing to severe or moderately severe AP for both cut-off points and for each criterion. It is striking that the highest cut-off point for the APACHE-II and Ranson scores and the lowest for TC and ACC are associated with a greater risk for having severe AP. The other cut-off point presents the opposite situation.
Sensitivity and specificity values, predictive values, and likelihood ratios of the factors analyzed for predicting the progression of acute pancreatitis to a grade of severity.
| Factor | S (%) | Sp (%) | PPV (%) | NPV (%) | LR+ | LR− |
| APACHE-II upon admission (cut-off point ≥ 5) | 69 | 69 | 47 | 85 | 2 | 0.37 |
| APACHE-II upon admission (cut-off point ≥ 7) | 54 | 88 | 64 | 83 | 4.38 | 0.53 |
| Ranson's at 48 h(cut-off point ≥ 1) | 100 | 13 | 32 | 100 | 1.14 | 0 |
| Ranson's at 48 h(cut-off point ≥ 2) | 92 | 37 | 37 | 92 | 1.47 | 0.2 |
| Total serum calcium(≤ 8.5 mg/dl) | 81 | 53 | 39 | 88 | 1.71 | 0.36 |
| Total serum calcium(≤ 8 mg/dl) | 73 | 73 | 50 | 88 | 2.43 | 0.38 |
| Corrected calcium(≤ 8.3 mg/dl) | 73 | 63 | 42 | 86 | 1.96 | 0.42 |
| Corrected calcium(≤ 7.9 mg/dl) | 58 | 76 | 47 | 82 | 2.4 | 0.56 |
S: sensitivity; Sp: specificity; PPV: positive predictive value; NPV: negative predictive value; LR+: positive likelihood ratio; LR-: negative likelihood ratio.
Source: Direct.
Relative risk associated with levels of total calcium, corrected calcium, and Ranson and APACHE-II scores as prognostic factors of moderately severe and severe acute pancreatitis.
| Factor | Moderately severe acute pancreatitisOR (95%CI) | Severe acute pancreatitisOR (95%CI) |
| APACHE-II upon admission(cut-off point ≥ 5) | 4.43 (1.41 – 13.95) | 3.12 (0.73 – 13.4)a |
| APACHE-II upon admission(cut-off point ≥ 7) | 3 (0.971 – 9.26)a | 8.93 (2.004 – 39.8) |
| Ranson's at 48 h(cut-off point ≥ 1) | 1.26 (1.13 – 1.41) | 1.12 (1.04 – 1.21) |
| Ranson's at 48 h(cut-off point ≥ 2) | 3.67 (0.77 – 1 7.38)a | 1.16 (1.054 – 1.28) |
| Total serum calcium(≤ 8.5 mg/dl) | 4.55 (1.21 – 17.1) | 2.97 (0.58 – 15.15)a |
| Total serum calcium(≤ 8 mg/dl) | 4.89 (1.56 – 15.35) | 6.32 (1.24 – 32.3) |
| Corrected calcium(≤ 8.3 mg/dl) | 4.77 (1.42 – 15.9) | 2.46 (0.58 – 10.5)a |
| Corrected calcium(≤ 7.9 mg/dl) | 2.3 (0.78 – 6.73)a | 5.25 (1.22 – 22.7) |
CI: Confidence interval; OR: odds ratio.
Source: Direct.
Our study results suggest that in patients with AP that are admitted within 72h of symptom onset, both TC and ACC within the first 24h of admission (cut-off point 7.5mg/dl) are adequate predictors of AP severity. With the 7.5mg/dl cut-off point, the S and Sp of the TC are very similar to those of the APACHE-II score and the PPV of the ACC is the highest of the 4 criteria analyzed.
Reliable identification of patients with early stage severe AP is complicated,32 and despite the fact that the Ranson and APACHE-II scores are widely used, they have negative aspects that complicate their use and interpretation as prognostic severity tests. Decision-making based on diagnostic tests requires adequate interpretation of the results and knowledge of their properties, mainly S, Sp, predictive values, and likelihood ratios. 33,34 In our study, we found that the Ranson's score was highly sensitive, but its Sp was regular, and its PPV was poor; especially when using the new AP classification criteria. The PPV of the Ranson's score indicated that its application produces a large number of false positives. These characteristics of the Ranson's score coincide with those reported in other studies that suggest that it cannot be regarded as an adequate prognostic scale. 35 Nevertheless, due to its elevated S, it can be a very good screening test. Another important limitation of the Ranson's score is that for its complete evaluation, data need to be collected up to 48h from the time of admission. This results in a significant delay for the patients with severe AP, given that during this period of time, fluid resuscitation or the search for spaces for intensive care management can be carried out. At any rate, the new version of the Atlanta criteria suggests that patients with moderately severe AP and severe AP can be treated in the same way until a precise classification is possible,30 and with the Ranson's score as the only criterion, it is not possible to make any prediction before 48h.
The APACHE-II score is less sensitive than the Ranson's score, but in relation to the maximum cut-off points, it is more specific and it has a higher PPV. Therefore, it has a lower proportion of false positives when the values surpass the cut-off point.35,36 These properties, that have been determined in numerous studies prior to the Atlanta Classification revision,6,9,10,12 were confirmed by the measurements obtained in our study (Table 4), making it a particularly useful test upon patient admission and a marker of improvement or worsening in later hours.
The most important limitation in using the APACHE-II score is that its calculation is complex and requires equipment that may not be available at the majority of medical units. Furthermore, it must be noted that when stricter cut-off points are considered, some of the advantages of the scale are lost, at least when the new AP classification is used (compare the sub-maximum cutoff points in Table 4).
With respect to the TC and ACC, in our study we found that the Sp and S values for TC with a cut-off point of 7.5mg/dl were very similar to those of the APACHE-II score, and its Sp was superior to that of the Ranson's score. A TC concentration lower than 7.5mg/dl would be enough to identify patients with severe AP as adequately as with the APACHE-II score. But if the TC value were to go under the second cut-off point (6.5mg/dl), the Sp values, predictive values, and likelihood ratios would surpass those of the 2 diagnostic scales (Table 4). In other words, when there was a TC concentration below 6.5mg/dl, the patients had a 60% probability of presenting with severe AP. This predictive value is even superior to that of the APACHE-II score, and shows us the necessity of understanding TC properties as a prognostic factor of AP severity. A calcium level between the 2 cut-off points (between 7.5 and 6.5mg/dl) will detect patients with severe pancreatitis as well as the APACHE-II does, but its capacity to adequately predict patient progression will be inferior. When the TC value goes below 6.5mg/dl, the predictive value will be 56% and diagnostic accuracy approximately 60% (calculated with the Fagan nomogram method and an estimated AP prevalence of 9.4%), which is superior to that of the Ranson and APACHE-II scores. Therefore, it is necessary to have the 2 TC cut-off points in mind when making the diagnosis and prognosis of patients with AP. As a practical example of the above-stated, in our study there were 2 patients that did not meet the cut-off point for detecting severity with the APACHE-II score upon admission; they had a TC under 7.5mg/dl, and they later developed severe AP.
In regard to ACC, with the 7.5mg/dl cut-off point, its S was the same as that of the rest of the criteria analyzed, but its PPV and LR+ were the highest. With the 6.5mg/dl cut-off point, its PPV reached 83% and its diagnostic accuracy was approximately 82% (calculated with the Fagan nomogram method and an estimated AP prevalence of 9.4%). These high prediction levels and the ease in calculating them when the serum albumin level is known, make obtaining the ACC concentration worthwhile, since it considerably increases diagnostic accuracy.
The repercussions of using the revised Atlanta Classification on the results of our study merit further comment. First of all, it brought about a decrease in cases labeled as severe AP, lowering the approximately 20% prevalence that was reported in studies based on the previous literature,5–8,10 to only 9.4%. This situation has an immediate impact on the properties of diagnostic tests and criteria, because it is well known that although S and Sp are independent from prevalence, predictive values and likelihood ratios are not. Even the most sensitive and specific diagnostic tests give a great number of false positives when they are used for diagnosing low prevalence diseases.34,37 Because the new classification is recent, we have not found any references on severe AP prevalence using the new criteria. But if the prevalence rates are similar, a decrease in the predictive characteristics of the tests similar to that observed in our study can be expected.
On the other hand, the fact that the new classification no longer refers to a dichotomy, but rather to a severity continuum of the disease, the conventional interpretation of diagnostic test results meets with complications. In principal, it is possible to opt for 2 solutions: to continue using the results in terms of severity and forgetting about the uncertain area that the term ‘moderately severe AP’ suggests, or to treat moderately severe AP as if it were severe AP, just as the international consensus that proposed the new classification does.30 But it is advisable to remember that severe AP is associated with higher mortality and complication rates that require different treatment alternatives,30 which is why we feel it is useful to manage the diagnostic tests precisely as a continuum. For example, we can see in Tables 4–6 as a whole, the maximum cut-off point for detecting severe AP with the APACHE-II scale is 8, but that the cut-off points 5 and 7 give us relevant information on the possibility of the patient presenting with moderately severe AP that does not progress to the severe status. The cut-off point of 5 enables more patients to be identified, but with a higher number of false positives and a greater probability of their finally presenting with moderately severe AP (OR=4.43). In contrast, the cut-off point of 7 has less S, but the patients at this level have a greater probability of progressing to severe AP (OR=8.93). The other prognostic criteria analyzed had very similar behavior, and this was especially notorious in the case of ACC. If these characteristics are confirmed in later studies, the tests will give us, more than the probability of a diagnosis, the probability that the patient will progress to a certain severity of AP. This knowledge will allow the attending physician to anticipate the therapeutic measures and additional studies necessary if the patient progresses to statuses of greater severity.
And finally, we wish to point out that a large number of hospital care centers have access to TC and ACC use, but not as many have access to the resources required for using the APACHE-II scale and other AP severity markers, such as C-reactive protein, interleukin 6, TMX, or procalcitonin. 6,12–14 Serum calcium and albumin for calculating ACC are simple biochemical markers that are routinely determined in the majority of hospital centers. Their use as prognostic factors of severity in AP would be valuable for identifying those persons that require intensive care, even at the primary and secondary care center levels.
ConclusionsSerum calcium and ACC obtained within the first 24h of hospital admission are useful predictors of severity in AP and have S, Sp, and predictive values that are comparable with those of the traditional prognostic scales. With an adequate interpretation of their cut-off points, they are valuable for identifying the patients that require intensive care support, even in primary and secondary care centers.
Financial disclosureNo financial support was received in relation to this article.
Conflict of interestThe authors declare that there is no conflict of interest.
Please cite this article as: Gutiérrez-Jiménez AA, Castro-Jiménez E, Lagunes-Córdoba R. Calcio sérico total y calcio corregido como predictores de severidad en pancreatitis aguda. Revista de Gastroenterología de México. 2014;79:13–21.

