


Ulcerative colitis (UC) is characterized by chronic, uncontrolled inflammation of the intestinal mucosa. Gut microbiota dysbiosis was reported to be a factor in intestinal inflammation. The aim of the present study was to study changes in the gut microbiome in Egyptian patients with active UC.
Materials and methodsIn this cross-sectional study, the gut bacterial microbiome of 21 UC patients and 20 control subjects was analyzed using the quantitative SYBR Green real-time PCR technique, targeting the 16S rRNA gene of selected bacterial phyla/genera and/or species.
ResultsUC patients showed marked dysbiosis evidenced by a significant decrease in the Firmicutes and F. prausnitzii anti-inflammatory bacteria. The Firmicutes/Bacteroidetes ratio was also lower in the UC cases (1.65), compared with the healthy controls (2.93). In addition, the UC cases showed a statistically significant decrease in Ruminococcus, compared with the control group. However, there were no statistically significant differences between UC patients and the controls, regarding A. muciniphila, Bifidobacterium, Lactobacillus, Bacteroides, and Prevotella. One UC case was positive for the pathogenic bacterium, Clostridioides difficile, with low relative abundance.
ConclusionThe current study showed differences in the gut microbiome of UC patients, compared with healthy controls. This may help in identifying the gut microbiome and specific bacterial changes that can be targeted for treatment of UC.
La colitis ulcerosa crónica idiopática (CUCI) se caracteriza por una inflamación crónica e incontrolada de la mucosa intestinal. Se ha informado que la disbiosis del microbioma intestinal es un factor de inflamación intestinal. El objetivo del presente estudio fue estudiar los cambios en el microbioma intestinal en pacientes egipcios con CUCI activa.
Materiales y métodosEn este estudio transversal, se analizó el microbioma intestinal de 21 pacientes con CUCI y 20 sujetos como grupo de control mediante la técnica de PCR cuantitativa SYBR Green en tiempo real dirigida al ARNr 16S de filos/géneros y/o especies bacterianas seleccionadas.
ResultadosLos pacientes con CUCI mostraron una marcada disbiosis evidenciada por una disminución significativa de las bacterias antiinflamatorias Firmicutes y F. prausnitzii. La relación Firmicutes/Bacteroidetes también fue menor en los casos de CUCI (1,65), en comparación con los controles sanos (2,93). Además, los casos de CUCI mostraron una disminución estadísticamente significativa en Ruminococcus en comparación con el grupo de control. Sin embargo, no hubo diferencia estadísticamente significativa entre los pacientes con CUCI y los casos de control en lo que respecta a A. muciniphila, Bifidobacterium, Lactobacillus, Bacteroides y Prevotella. Un caso de CUCI fue positivo a Clostridioides difficile, de baja abundancia relativa.
ConclusiónEl presente estudio mostró diferencias en el microbioma intestinal de los pacientes con CUCI en comparación con los controles sanos. Esto puede ayudar a identificar el microbioma intestinal y los cambios bacterianos específicos que pueden ser objeto de tratamiento de la CUCI.
The gut microbiome has recently been recognized as an important triggering factor for autoimmune diseases. Gut dysbiosis plays a critical role in dysregulation of the immune response and has been linked to inflammation, tissue damage, and loss of immune tolerance.
New findingsEgyptian patients with active ulcerative colitis (UC) showed dysbiosis of the gut microbiome. This highlights an important relationship between gut microbial dysbiosis and the etiopathogenic chain of UC. Such a finding points to the potential therapeutic benefits of manipulating the composition of the gut microbiome in the management of UC, or even protection against the disease.
Inflammatory bowel disease consists of 2 main disorders: ulcerative colitis (UC) and Crohn’s disease. The hallmark of UC is chronic uncontrolled inflammation of the intestinal mucosa1. The etiology and pathogenesis of UC are still confusing, but involve a multifactorial influence of genetic, environmental, microbial, and inflammatory factors2.
The human gut is one of the most densely populated ecosystems known. Based on molecular analyses, the majority of bacteria belong to 2 phyla, Bacteroidetes and Firmicutes. Faecalibacterium prausnitzii is a major member of the Firmicutes phylum and one of the main butyrate-producing bacteria in the healthy human microbiota3,4. Butyrate production has been correlated with the capacity to induce IL-10, an anti-inflammatory cytokine5. F. prausnitzii has also been found to be a strong inducer of IL-10-secreting regulatory T cells6. Butyric acid tightens the junctions between epithelial cells and induces mucin synthesis, thus preventing inflammation and leaky gut syndrome7.
Lactobacilli and Bifidobacteria produce bactericidal acidic substances, such as lactic acid, bacteriocins, and short-chain fatty acids. Said fatty acids are involved in the stimulation of mucus production, prevention of inflammation, and in increasing total and pathogen-specific mucosal IgA8.
A. muciniphila resides in the mucus layer of the large intestine, where it is involved in maintaining intestinal integrity, by increasing mucus thickness and increasing gut barrier function9.
Intestinal inflammatory responses can be due to disruption of the gut microbiota, known as dysbiosis. Said disruption leads to a rapid increase in harmful bacteria in the intestine. In addition, it increases intestinal mucosal permeability due to the release of enterotoxin, and the production of immunosuppressive protein results in immune dysfunction. Growing populations of harmful bacteria directly invade and damage the intestinal epithelial cells, which leads to damage of the intestinal mucosal barrier10.
The present study was designed to elucidate changes in the gut microbiome in Egyptian patients with active UC and to correlate those bacteria with the severity of UC. This may have an impact on the future understanding of the pathogenesis of UC and on possible approaches to its prevention and treatment.
Materials and methodsParticipantsThis cross-sectional study included 21 Egyptian patients with active UC that were recruited from the gastroenterology outpatient clinic of the Alexandria Main University Hospital, as well as from its gastroenterology inpatient ward, and 20 Egyptian healthy subjects with matched age, sex, and body mass index, as the control group. The dietary habits of all participants were assessed through a food frequency questionnaire.
Exclusion criteriaMalignancy; recent surgical intervention of the small or large intestine within the last 6 months; infectious diarrhea including bacterial, viral, and parasitic diarrhea excluded by stool analysis, culture, and polymerase chain reaction (PCR) for certain pathogens; a history of prolonged use of antibiotics; nonsteroidal anti-inflammatory drug abuse; a history of corticosteroid, methotrexate, azathioprine, or 6-mercaptopurine use for the past 3 months; biologic therapy; other autoimmune diseases; pregnancy; severe burn; sepsis; chronic renal and liver diseases; diabetes mellitus; pure vegetarianism; alcohol or substance addiction; inability to give consent due to a mental disorder; and children. Patients were required not to have taken any active drugs for the treatment of UC, such as 5-aminosalicylic acid or salazosulfapyridine, one week before entering the study.
Ethical considerationsThe study follows the principles of the Declaration of Helsinki (1964) and was approved by the Medical Research Ethics Committee of the Alexandria Faculty of Medicine, Egypt.
Signed statements of informed consent were obtained from all patients, expressing their acceptance to participate in the study and giving their permission for the results to be published.
All patients and controls had their complete medical histories taken and a full clinical examination. UC was diagnosed, based on clinical, radiologic, endoscopic, and histologic examinations11. UC activity was determined, according to a composite of clinical and endoscopic indexes (the Mayo Clinic Index and the Disease Activity Index), with scores ranging from 0 to 12 points (from no activity to the most severe activity) and sub-scores (combining rectal bleeding, stool frequency, and the Physician’s Global Assessment or the Endoscopy sub-score)12.
Laboratory tests, colonoscopy, and histopathologic studyRoutine laboratory workup was performed, including complete blood count, serum liver enzymes (alanine aminotransferase and aspartate aminotransferase), albumin, bilirubin, HBsAg, and HCVAb, fasting and postprandial blood sugar, serum cholesterol, triglycerides, blood urea nitrogen, creatinine, erythrocyte sedimentation rate (ESR), C-reactive protein (CRP), fecal calprotectin, and pANCA.
Colonoscopy was carried out on all patients. Bowel preparation was a low-fiber diet on the day preceding the colonoscopy and a split regimen of 4 L of polyethylene glycol (PEG) solution (or a same-day regimen in the case of afternoon colonoscopy), no longer than 4 h before the colonoscopy. Four biopsy specimens from 5 sites, including the ileum and rectum, were obtained from both affected and normal-appearing mucosa; specimens from different locations were labeled and submitted separately.
The biopsy specimen underwent histopathologic examination.
Microbiome studyFresh stool samples were collected from cases and controls and stored in aliquots at −80 °C for further processing.
DNA extractionDNA was extracted from 180 to 220 mg stool samples using QIAamp® Fast DNA Stool Mini Kit (Qiagen, Germany), according to the manufacturer’s instructions. DNA extracts were stored at −80 °C until PCR testing. Two µl of DNA extract were used in the PCR reaction.
SYBR Green real-time PCRThe real-time PCR protocol was performed, as previously described by Tomova et al. (2015)13. Specific PCR primers were used to target selected phyla, genera, or species constituting the gut microbiota (Bacteroides, Prevotella, Ruminococcus, Bacteroidetes, Firmicutes, Bifidobacterium, Lactobacillus, Clostridioides difficile, A. muciniphila and F. prausnitzii), in addition to a broad-range primer targeting the conserved 16SrRNA gene sequences of all the bacteria, whose amplification served as the denominator against which the amplification of other bacteria was estimated.
Amplification was performed in a real-time PCR cycler, the Rotor-Gene Q (Qiagen, Germany) using a SensiFAST™ SYBR® No-ROX PCR kit (Bioline Co., UK). It was performed in 20 µl reaction volumes, containing 4 pmols of each primer. The reaction consisted of initial denaturation at 95 °C for 10 min, followed by 40 cycles of denaturation at 95 °C for 30 s, annealing at 60 °C for 30 s, and extension at 72 °C for 30 s. Melting curve analysis was performed to check the specificity of the amplified products. Quantification of specific bacterial DNA was expressed as relative quantification (the cycle threshold [Ct] at which DNA for a specific target was detected, relative to the Ct at which universal bacterial DNA was detected). Relative quantification was calculated automatically by the Rotor Gene software and expressed as relative fold change13.
The enterotype of all participants was determined, according to the dominant type present in each of the 3 bacteria: Bacteroides (enterotype 1), Prevotella (enterotype 2) or Ruminococcus (enterotype 3).
Statistical analysisData were entered into the computer and analyzed using the IBM SPSS software package version 20.0. (Armonk, NY: IBM Corp., USA). The qualitative data were described, using number and percentage, and the Kolmogorov-Smirnov test was used to verify the normality of distribution. The quantitative data were described, using range (minimum and maximum), mean, standard deviation, median, and interquartile range (IQR). Significance of the results was judged at the 5% level.
To compare different groups, the chi-square test was used for the categorical variables. For the 2 study groups, the normally distributed quantitative variables were compared, utilizing the Student’s t test, and the abnormally distributed quantitative variables were compared, using the Mann-Whitney U test. To compare more than 2 study groups, the Kruskal-Wallis test was utilized for the abnormally distributed quantitative variables. The Pearson coefficient was used to correlate 2 normally distributed quantitative variables and regression was utilized to detect the most independent factor that affected Ruminococcus.
To evaluate the degree of variation of the microbial community structure within a sample, we measured the alpha diversity by employing the Shannon diversity index14, and to evaluate the degree of similarity between cases of UC and their siblings or controls, we employed the Bray-Curtis similarity index15.
ResultsDemographic dataThe present study was carried out on 21 UC patients. Seventeen of the patients were males and 4 were females, with a 4.3:1 male-to-female ratio. Patient age ranged from 18 to 43 years, with a mean age of 28.90 ± 6.55 years. The control group was comprised of 20 cases; 11 males and 9 females, and their age ranged from 20 to 42 years, with a mean age of 29.75 ± 5.17 years.
Clinical and laboratory dataNone of the patients had a positive family history of UC. Disease duration ranged from 1 to 7 years, with a mean of 1.86 ± 1.56 years. The total Mayo Score ranged from 4 to 12, producing a mean of 9.05 ± 2.38, with 2 (9.5%) mild, 12 (57.1%) moderate, and 7 (33.4%) severe cases. Table 1 shows the different items of the Mayo Score.
Distribution of the UC cases, according to clinical, laboratory, endoscopic, and histopathologic data
| Disease duration | |
| Min-Max | 1.0-7.0 |
| Mean ± SD | 1.86 ± 1.56 |
| Median (IQR) | 1.0 (1.0-2.0) |
| Fecal calprotectin | |
| Min-Max | 98-2810 |
| Mean ± SD | 533.95 ± 714.20 |
| Median (IQR) | 180 (120-610) |
| CRP | |
| Min-Max | 7-102 |
| Mean ± SD | 40.43 ± 34.94 |
| Median (IQR) | 20 (12-76) |
| pANCA n (%) | |
| Negative | 17 (81) |
| Positive | 4 (19) |
| Colonoscopic findings n (%) | |
| Disease extension | |
| Pancolitis | 7 (33) |
| Left-sided colitis | 10 (48) |
| Proctitis | 4 (19) |
| Macroscopic features | |
| Vascular pattern | |
| Decrease | 2 (9.5) |
| Loss | 19 (90.5) |
| Erythema of the mucosa | |
| Mild | 2 (9.5) |
| Marked | 19 (90.5) |
| Spontaneous bleeding and severe ulcerations | 7 (33) |
| Friability/granularity | |
| Mild | 7 (33) |
| Severe | 14 (67) |
| Erosions/ulceration | 12 (57) |
| Pseudopolyps | 3 (14) |
| Microscopic features | |
| Crypt architectural distortion | 21 (100) |
| Crypt atrophy | 21 (100) |
| Crypt infiltration | 20 (95) |
| Decreased crypt density | 12 (57) |
| Crypt abscess | 21 (100) |
| Cryptitis | |
| Basal lymphoplasmacytosis | 13 (62) |
| Paneth cell metaplasia | 18 (85.7) |
| Mucin depletion | 16 (76) |
| Surface erosion/ulceration | 20 (95) |
| Infiltration by inflammatory cells | |
| Neutrophil-predominant (greater than 70% of active inflammatory cells) | 7 (33.4) |
| Eosinophilic-predominant (greater than 70% of active inflammatory cells) | 9 (42.8) |
| Mixed (neutrophils and eosinophils) | 5 (23.8) |
| Total Mayo Score/12 | |
| Min-Max | 4.0-12.0 |
| Mean ± SD | 9.05 ± 2.38 |
| Median (IQR) | 9.0 (8.0-11.0) |
| Stool frequency/day n (%) | |
| 1 | 3 (14.3) |
| 2 | 10 (47.6) |
| 3 | 8 (38.1) |
| Rectal bleeding n (%) | |
| 1 | 2 (9.5) |
| 2 | 8 (38.1) |
| 3 | 11 (52.4) |
| Endoscopic findings n (%) | |
| 1 | 2 (9.5) |
| 2 | 12 (57.1) |
| 3 | 7 (33.4) |
| Global assessment by physician n (%) | |
| 1 | 3 (14.3) |
| 2 | 13 (61.9) |
| 3 | 5 (23.8) |
In addition, fecal calprotectin ranged from 98-2,810, with a mean of 533.95 ± 714.20, and CRP ranged from 7-102 with a mean of 40.43 ± 34.94. Seventeen of the 21 patients (81%) were negative for pANCA and 4/21 (19%) were positive.
Endoscopic and histologic dataConventional colonoscopic examination was carried out on all patients. A decrease in the normal vascular pattern and mild erythema was found in 2 patients and a complete loss of the vascular pattern and marked erythema were found in 19 patients. Mucosal friability was mild in 7 patients and severe in 14 patients. Erosions were seen in 12 patients. Severe ulcerations and spontaneous bleeding were found in 7 patients. Pseudopolyps were seen in 3 patients. Table 1 shows the macroscopic and microscopic findings.
Gut microbiome analysisQuantification of specific bacterial DNA was not expressed as an absolute number, but rather was relative to the total bacterial DNA present in the stool sample. The mean of the relative difference values of the various bacteria were shown at instances in which the decimal value was low, such as E-05 (4.75 × 10⁻⁵ is shown as 4.75E-05).
Phylum level analysisThe bacterial phylum analysis showed that patients with UC had a statistically significant decrease in Firmicutes (p < 0.001), and although Bacteroidetes was decreased, the difference was not statistically significant, when compared with the control group. In addition, although the Firmicutes/Bacteroidetes ratio was lower in the UC cases (1.65), when compared with the healthy controls (2.93), the difference was not statistically significant (Table 2) (Fig. 1).
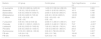
Comparison of the bacterial relative abundance in the study groups
| Bacteria | UC group | Control group | Test of significance (U) | p value |
|---|---|---|---|---|
| A. muciniphila | 2.19E-03 (3.96E-04-2.45E-02) | 1.43E-03 (7.23E-04-3.29E-03) | 190.0 | 0.602 |
| Bacteroides | 7.0E-02 (1.0E-02-2.50E-01) | 1.40E-01 (6.0E-02-3.50E-01) | 167.0 | 0.262 |
| Bacteroidetes | 5.0E-02 (4.93E-04-4.50E-01) | 2.50E-01 (8.0E-02-5.60E-01) | 159.50 | 0.188 |
| Bifidobacterium | 2.0E-02 (3.49E-03-7.0E-02) | 4.0E-02 (1.0E-02-2.60E-01) | 143.50 | 0.083 |
| C. difficile | 0.0E + 00 (0.0E + 00-0.0E + 00) | 0.0E + 00 (0.0E + 00-0.0E + 00) | 200.0 | 0.329 |
| F. prausnitzii | 3.0E-02 (1.0E-02-5.0E-02) | 2.40E-01 (1.20E-01-3.30E-01) | 44.0* | <0.001* |
| Firmicutes | 2.30E-01 (1.00E-01-3.50E-01) | 4.60E-01 (3.40E-01-7.50E-01) | 79.0* | <0.001* |
| Lactobacilli | 2.0E-02 (3.33E-03-7.00E-02) | 7.0E-02 (1.00E-02-1.70E-01) | 160.0 | 0.192 |
| Prevotella | 2.0E-02 (3.92E-03-1.40E-01) | 1.0E-02 (3.60E-03-1.80E-01) | 204.0 | 0.876 |
| Ruminococcus | 3.31E-03 (1.82E-04-1.0E-02) | 3.0E-02 (1.79E-03-6.0E-02) | 79.0* | 0.001* |
| F/B ratio | 1.65 (0.8-118) | 2.93 (1.31-7.96) | 193.50 | 0.657 |
| P/B ratio | 1.44 (0.08-4.05) | 0.24 (0.02-1.75) | 152.0 | 0.106 |
The median (interquartile range from the 25th to 75th percentiles) relative abundance of the bacteria is shown.
F/B ratio: Firmicutes/Bacteroidetes ratio; P/B Ratio: Prevotella/Bacteroides ratio; U: Mann-Whitney test.
, the whiskers represent the minimum and maximum: UC: control.")
Patients with UC showed a statistically significant decrease in Ruminococcus, when compared with the control group (p = 0.001), whereas there was no statistically significant difference between the UC patients and the controls, regarding Bacteroides and Prevotella (Table 2) (Fig. 1). There was also no statistically significant difference between the UC group and the control group, with respect to the Prevotella/Bacteroides ratio (Table 2, Fig. 1).
Species level analysisRegarding the beneficial bacteria, patients with UC showed a statistically significant decrease in F. prausnitzii, in comparison to the control group (p < 0.001). However, there was no statistically significant difference between the UC patients and the control cases, with respect to A. muciniphila, Bifidobacteria, and Lactobacilli (Table 2) (Fig. 1).
For the pathogenic bacterium, Clostridioides difficile, none of the control cases were positive and only one UC case was positive, with a relative abundance of 2.10E-6.
In relation to the 3 severity groups of the UC cases, although the beneficial bacteria (A. muciniphila, Bifidobacterium, F. prausnitzii, and Firmicutes) were higher in the mild cases, than in the moderate and severe cases, the difference was not statistically significant.
Correlation with clinical parametersWhen studying the correlation between the relative abundance of the different gut microbiota and disease duration, the total Mayo Score and its items, fecal calprotectin, and pANCA, no statistically significant correlations were detected, except for a significant positive correlation between A. muciniphila and fecal calprotectin (r = 0.613, p = 0.003). There was also a significant positive correlation between Ruminococcus and fecal calprotectin (r = 0.448, p = 0.041) and disease duration (r = 0.467, p = 0.033).
A multivariate linear regression analysis of the parameters affecting Ruminococcus, in the UC cases, produced a statistically significant correlation between the endoscopic score and fecal calprotectin, whereas there was no statistically significant correlation with disease duration (Table 3).
Multivariate linear regression analysis for the parameters affecting Ruminococcus for the UC group
| Ruminococcus | Multivariatea | |
|---|---|---|
| p | B (95% CI) | |
| Disease duration | 0.530 | 0.001 (−0.001 to 0.002) |
| Endoscopic score | 0.008* | 0.007 (0.002–0.012) |
| Fecal calprotectin | 0.049* | 3.442E-006 (0.000–0.000) |
B: unstandardized coefficients; CI: confidence interval.
The Shannon diversity index takes both species richness and evenness into account and demonstrated a lower degree of microbial diversity in the UC cases, than in the healthy controls. The median diversity index value for UC was 1.41 (mild cases = 1.24, moderate = 1.42, severe = 1.44) and it was 1.48 in the healthy controls. No statistically significant difference was observed between the UC cases (Table 4).
Similarity indexThe Bray-Curtis Similarity Index was performed for assessing the similarity and dissimilarity between the UC cases and healthy controls. Compared with the healthy controls, the mean of dissimilarity (difference) for UC was 57%, ranging from 20-91%.
The mild, moderate, and severe UC cases showed an average dissimilarity, in relation to the healthy controls, of 41, 60, and 58%, respectively. However, no statistically significant difference in severity was observed.
Enterotypes in the study participantsTen (47.6%) of the UC patients were assigned to enterotype 1, 10 (47.6%) to enterotype 2, and only 1 to enterotype 3. On the other hand, 13 (65%) of the control cases were assigned to enterotype 1, 7 (35%) to enterotype 2, and none to enterotype 3. No statistically significant difference was detected between the 2 groups, regarding enterotype distribution (p = 0.436).
DiscussionUlcerative colitis is believed to be caused by an imbalance between the intestinal microbiota and mucosal immunity, resulting in excessive intestinal inflammation. Underrepresentation of the anti-inflammatory bacteria and a relative increase of pro-inflammatory bacteria play an important role in the pathogenesis of UC10.
According to the results of the present study, our UC patients showed marked dysbiosis evidenced by a significant decrease in the Firmicutes phylum and the F. prausnitzii species, the main butyrate producer having anti-inflammatory properties and an immune modulatory role in gut homeostasis. Albeit not statistically significant, the Firmicutes/Bacteroidetes ratio was also lower in the UC cases (1.65), compared with the healthy controls (2.93).
Our results concur with studies showing that the Firmicutes phylum and F. prausnitzii species were significantly lower in UC patients than in the healthy subjects16,17. However, they differ from studies reporting that the Bacteroidetes phylum was underrepresented in mucosal samples from UC patients, compared with healthy subjects16,18.
Ruminococcus showed a statistically significant decrease in the UC cases, in comparison to the control group (p = 0.001). However, there was no statistically significant difference, regarding Prevotella, Bacteroides, and the Prevotella/Bacteroides ratio, concurring with results by Frank et al. (2007) and Morgan et al. (2012)16,19, who showed that Ruminococcus, particularly the butyrate-producing species, was reduced in inflammatory bowel disease.
Concerning the beneficial bacteria associated with healthy gut (A. muciniphila, Bifidobacteria, and Lactobacilli), there was no statistically significant difference between the UC patients and the control cases, in the present study. Those results are in contrast to the finding of other studies that show a decrease of Bifidobacteria and A. muciniphila in fecal samples from UC patients, compared with healthy subjects20,21.
In our study, the pathogenic bacterium, Clostridioides difficile, was positive in one UC case, with low relative abundance (2.10E-6), concurring with a previous study that enrolled outpatient cases, with no recent history of antibiotic intake or hospitalization22.
Regarding the relation between dysbiosis and the severity of UC cases in the present study, beneficial bacteria (A. muciniphila, Bifidobacteria, F. prausnitzii, and Firmicutes) were higher in the mild cases, than in the moderate and severe cases, but the difference was not statistically significant, which was to be expected, given that there were only 2 mild cases.
Gut microbial diversity has been reported to be a new biomarker of health and metabolic capacity, because great microbial gut diversity has the ability to protect the human gut from environmental stresses23.
A significant difference in the gut microbiome of healthy individuals and patients with inflammatory bowel disease, in terms of load and diversity, has been confirmed24. The Shannon index demonstrated that our study groups exhibited a similar degree of alpha diversity, which was an expected finding, given that a limited number of bacterial genera and/or species were targeted in this study.
Fecal calprotectin has been proposed as a noninvasive surrogate marker of intestinal inflammation in inflammatory bowel disease and has also been correlated as a disease activity marker. The level of the inflammatory marker, fecal calprotectin, correlates significantly with endoscopic colonic inflammation in UC. In our study, there was no statistically significant correlation between different bacterial relative abundance, disease duration, total Mayo Score, fecal calprotectin, and pANCA, except for a significant positive correlation between A. muciniphila and Ruminococcus with fecal calprotectin.
Those results contrast with that reported by Chen et al. (2020)25 who demonstrated a negative association of A. muciniphila and Ruminococcus with fecal calprotectin.
A limitation of our study was the small sample size, which could have led to a loss of statistical significance at certain points.
ConclusionThe present study provided evidence on the presence of changes in the gut microbiome of UC patients, compared with healthy controls. Those observations highlight the importance of identifying the microbiome and the specific bacterial changes that can be targeted for treating UC.
Author contributionEA and DH designed the study and carried out the sample and data collection. SA analyzed the data. NZ and NB drafted the manuscript. All authors critically revised the manuscript, approved the final version to be published, and agreed to be accountable for all aspects of the work.
Financial disclosureNo specific grants were received from public sector agencies, the business sector, or non-profit organizations in relation to this study.
Conflict of interestThe authors declare that there is no conflict of interest.
All authors wish to thank Dr. Shwikar M. AbdelSalam Ahmed for her support with the data analysis, Dr. Nermine Hossam Zakaria and Dr. Nahed M. Baddour for drafting the manuscript, Dr. Ezzat Ahmed and Dr. Doaa Header for the concept and design and data acquisition.
Please cite this article as: Ahmed EA, Ahmed SM, Zakaria NH, Baddour NM, Header DA. Estudio del microbioma intestinal en pacientes egipcios con colitis ulcerosa crónica idiopática. Rev Gastroenterol Méx. 2023;88:246–255.

