
Colonoscopy is the most utilized screening test for colorectal cancer (CRC). The adenoma detection rate (ADR), cecal intubation rate (CIR), and withdrawal time (WT) are established quality indicators (QIs) for colonoscopy. The aim was to measure the effect of individual and group QIs in colonoscopy by providing quarterly meetings and email feedback on ADR, CIR, and WT.
Material and methodsThis is a prospective study in 2 steps. In the initial phase, we aimed to collect the QIs in colonoscopy from our division and in the second step, we aimed to assess the impact of a quarterly report. Pre-Intervention: Using electronic medical records (EMRs), an automated method for calculating the ADR was devised. ADRs from 6 months were obtained. Periodic Feedback: Endoscopists received quarterly feedback during staff meetings and emails for 9 months. Post-Intervention: QIs were recalculated for 8 months, and physicians did not receive reports.
ResultsOver 23 months, 1,137 screening colonoscopies were conducted. Seven gastroenterologists participated, distributed into high (n = 6) and low (n = 1) detector groups. The mean patient age was 58.6 ± 9.2 years, with 659 (57.9%) females. Moderate sedation was used in 892 (78.4%) cases. QIs did not show significant improvement during the feedback or post-intervention periods compared with the pre-intervention period. Endoscopists initially categorized as «low detectors» exhibited the most substantial improvement, with the ADR increasing from 23.5% to 61.5% (P < .001).
ConclusionQuarterly feedback and email reports did not significantly improve colonoscopy quality measures. Regarding the ADR, the intervention’s impact was most prominent in «low detectors».
La colonoscopía es la prueba de tamizaje más utilizada para la detección de cáncer colorrectal (CCR). Las tasas de detección de adenomas (TDA) e intubación cecal (TIC) y el tiempo de retirada (TR) son indicadores de calidad (ICC) para la colonoscopía. El objetivo fue medir el efecto de retroalimentar a los médicos con sus ICC en reuniones trimestrales y por correo electrónico sobre TDA, TIC y TR.
Material y métodosEstudio prospectivo en 2 pasos. En la fase inicial, nuestro objetivo fue recopilar los ICC de los integrantes de nuestro departamento. En el segundo paso, el objetivo fue evaluar el efecto de la retroalimentación. Preintervención: utilizando los expedientes electrónicos se diseñó un método automatizado para calcular las TDA. Se obtuvieron los datos de 6 meses. Retroalimentación periódica: los endoscopistas recibieron retroalimentación trimestral durante las reuniones del departamento y correo electrónico durante 9 meses. Postintervención: los ICC se calcularon durante 8 meses y los médicos no recibieron informes.
ResultadosDurante 23 meses, se realizaron 1137 colonoscopias de tamizaje. Participaron 7 gastroenterólogos, distribuidos en grupos de detectores altos (n = 6) y bajos (n = 1). La edad media fue de 58.6 ± 9.2 años, con 659 (57.9%) mujeres. Se utilizó sedación moderada en 892 (78.4%) casos. Los ICC no mostraron una mejoría significativa durante los períodos de retroalimentación o postintervención en comparación con el período preintervención. Los endoscopistas inicialmente categorizados como «detectores bajos» mostraron la mejoría más pronunciada, con un aumento de la TDA del 23.5% al 61.5% (P < .001).
ConclusiónLa retroalimentación trimestral y los informes por correo electrónico no mejoraron significativamente los ICC. En la TDA, el impacto de la intervención fue evidente en los «detectores bajos».
Colonoscopy is the most widely used colorectal cancer (CRC) screening test in the United States.1 Based on 2010 data, over 3.3 million outpatient colonoscopies are performed annually in the United States, with screening and polyp surveillance accounting for half of the indications.2 Colonoscopy has a pivotal role in preventing CRC. The quality of colonoscopy performance is a critical factor. Studies have shown that the adenoma detection rate (ADR) is highly variable among different endoscopists.3,4 More importantly, individual endoscopists’ ADRs are independent predictors of interval CRC risk after colonoscopy screening.5 Endoscopist-level variability in ADR can impact a higher rate of post-colonoscopy CRC.6,7 Since colonoscopy is also associated with adverse events, practitioners of colonoscopy must perform high-quality procedures.
ADR, cecal intubation rate (CIR), and withdrawal time (WT) are all well-established colonoscopy quality indicators.8,9 Feedback on these indicators has been proposed as part of institutional quality assurance programs. Feedback often takes the shape of physician “report cards,” whereby endoscopists are provided with their own performance indicators, group/practice averages, evidence-based benchmarks, or both.10,11 Although some studies suggest endoscopist feedback is associated with improved colonoscopy quality indicators, others do not.12
The aim was to measure the effect of individual and group quality indicators (QIs) in colonoscopy by providing quarterly meetings and email feedback on ADR, CIR, and WT.
Material and methodsThis is a prospective study. In October 2021, a two-step project was developed. In the first step, the goal was to obtain the individual and group ADRs from the members of our gastroenterology division. The second step was to measure the effect of a trimonthly report about ADR, CIR, and WT at divisional meetings and by email on personal and group quality colonoscopy measures.
Before sending the study to the journal for review, informed consent was obtained from all participating gastroenterologists. The institutional review board (IRB) was informed about our project and considered that no formal review was needed.
Endoscopic procedureTechnical aspectsOlympus colonoscopes (CF-Q1190L, Olympus, Tokyo, Japan) were used. All colonoscopies were performed at an endoscopy unit by board-certified (or board-eligible) gastroenterologists or by gastroenterology fellows under the supervision of Gastroenterology attending physicians. The data collected were the presence or absence of polyps, histology of the polyps, clinical evaluation report (CER), insertion time, WT, and score for colon preparation. The quality of colonic preparation was assessed according to the Boston Bowel Preparation Scale (BBPS).13
Definitions/quality measuresThe average-risk population was defined as asymptomatic adults 45 years of age or older who are at average risk of colorectal cancer (i.e., no prior diagnosis of colorectal cancer, adenomatous polyps, or inflammatory bowel disease; no personal diagnosis or family history of known genetic disorders that predispose them to a high lifetime risk of colorectal cancer [such as Lynch syndrome or familial adenomatous polyposis]).
Screening colonoscopy was defined as the first colonoscopy procedure in the average-risk population. Procedure time was defined as the time taken from the moment the colonoscope was inserted, including therapeutic procedures, to the moment of complete withdrawal of the colonoscope. Withdrawal time was defined as the time taken to remove the colonoscope from the cecal pole minus the time of therapeutic interventions until the complete withdrawal of the colonoscope. The ADR was defined as the percentage of screening colonoscopies with one or more adenomas detected and removed.14
Advanced adenomas were defined as lesions greater or equal to 1 cm in size and those with villous histology or high-grade dysplasia. Sessile serrated lesions included sessile serrated polyp/adenoma and traditional serrated adenomas under the classification system of the World Health Organization.
Patients drank a split-dose bowel preparation of an oral solution. The oral solution was 2 pouches labeled Pouch A and 2 pouches labeled Pouch B. Each Pouch A contained 100 g of PEG 3350, 7.5 g of sodium sulfate, 2.691 g of sodium chloride, and 1.015 g of potassium chloride. Each Pouch B included 4.7 g of ascorbic acid and 5.9 g of sodium ascorbate. The split dose was dose 1 the evening before the colonoscopy and dose 2 the morning of the colonoscopy (approximately 12 hours after the start of dose 1 and at least 3 ½ hours prior to the colonoscopy). Patients were scheduled once they drank the dose 1 bowel preparation the evening before the colonoscopy. Colonoscopies with fair or poor preparation and incomplete colonoscopies were excluded from the study. Good colon preparation was considered when it was satisfactory enough to detect polyps bigger than 5 mm or the BBPS scores were 2/3 in each segment; otherwise, preparation was considered inadequate/poor.15
ProcedureColonoscopies were carried out under moderate sedation or monitored anesthesia care (MAC) with continuous monitoring of vital signs, oxygen saturation, and electrocardiogram (ECG) tracing. Supplemental oxygen was provided during the procedure. The procedure was performed according to standard recommendations. The patient was in the left lateral position, and the colonoscope was introduced until it reached the cecum. Routinely, up to five attempts were made to intubate the ileocecal valve. We used a timer integrated into the computer processor, which was activated at the time of insertion of the colonoscope, marked the time for cecal intubation, and stopped when the colonoscope was removed. Polyps detected during the colonoscopy were removed with standard forceps and/or a polypectomy snare, depending on the size of the polyp and/or physician preference, which was estimated with an open forceps (5 mm) and later classified into three different size groups (≤5 mm, 6 mm to ≤9 mm, and ≥1 cm). Polyps were placed in separate containers depending on their location in the colon (cecum, ascending colon, transverse colon, descending colon, sigmoid colon, and rectum).
HistopathologyPolyps were analyzed by the institutional Pathology Department. All polyps were classified as hyperplastic polyps, tubular adenomas, tubulovillous adenomas, villous adenomas, traditional serrated adenoma (TSA), sessile serrated lesion (SSL), or adenocarcinomas. All pathologists were blinded to the method used during the procedure.
Intervention/study outcomePre-intervention. Between February and March 2022, an automatic method to calculate the ADR achieved by gastroenterologists in our hospital was developed. The data were obtained from the colonoscopy reports in the electronic medical records (EMRs). During this period, the project was developed and implemented. The gastroenterologists were not aware of the project. ADRs from January to June 2022 were obtained individually and as a group.
Periodic Feedback. Between July 2022 and March 2023, endoscopists were shown the data regarding the given quality measurements calculated for each endoscopist (anonymized) and the group, during monthly staff meetings over 9 months. All endoscopists were individually informed of their identifier on the graph in trimonthly private electronic email communications but were not informed of the other endoscopists’ specific values.
Post-intervention. After the feedback, the quality measures were calculated between April and October 2023. The physicians did not receive reports during this period.
These measures were then compared between the pre-intervention period, the feedback period, and the post-intervention period.
Based on the ADR calculated in the pre-intervention period, endoscopists were subdivided into one of three groups. “Low detectors” included endoscopists with ADRs less than or equal to 25%, “average detectors” included endoscopists with between 26 and 35% ADRs, and “high detectors” represented endoscopists with ADRs above 35%.
Data extractionData extraction was performed from the Epic Electronic Medical Records system, focusing on completed colonoscopy procedures, colonoscopy details, associated diagnoses, and the procedure narratives. A review of associated diagnostic records enabled differentiating screening colonoscopies from other indications. The diagnosis linked with the pathology records allowed the team to isolate cases where adenomas were detected. We employed pattern-matching techniques using regular expressions to distill detailed insights from the colonoscopy procedure narratives. This approach facilitated the precise identification of specific times allocated to each segment of the colonoscopy and the assessment of the preparation quality before the procedure.
We integrated these elements into a report utilizing Microsoft Power BI upon extracting and refining the dataset. This platform allowed us to construct a dashboard that presented a series of comparative statistics tailored for each endoscopist. QIs were calculated and displayed. The visualization tool’s interactive capabilities enabled an intuitive exploration of the data to be made and the overall performance of each endoscopist to be classified.
Statistical analysisQuality measures were presented as relative and absolute frequencies and non-parametric statistics for central tendency and dispersion. To compare proportions before and after the intervention, the McNemar X2 test was used. For the continuous variables, the T-paired test or Wilcoxon test was used, according to the distribution. Data for the continuous variables were presented as a mean (SD) or median (min-max), according to the distribution. ADR, WT, and CIR quality measures were presented as proportions. A P value of <.05 was considered statistically significant.
Ethical considerationsNo patients were included in this study, and it was submitted to the local IRB. They concluded that no IRB authorization was needed because no patients were included, and the authors were the study participants.
THE STROBE checklist was used.
ResultsData from 23 months were analyzed and classified into three different periods in relationship to the maneuver. In that period, 1,137 screening colonoscopies were performed on the same number of patients (219 patients in the pre-intervention period, 519 patients during the feedback period, and 399 patients during the post-intervention period). Seven board-certified or board-eligible gastroenterologists participated and were stratified as high (n = 6), average (n = 0), and low (n = 1) detectors. The number of colonoscopies performed by these endoscopists ranged from 43 to 439 during the entire study period.
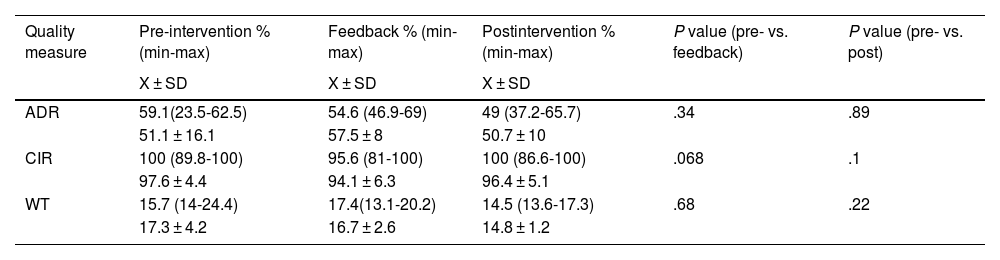
The average patient age was 58.6 ± 9.2 years, and 659 (57.9%) were female. Moderate sedation was used in 892 (78.4%) cases. The colon preparation was reported as adequate in 1,079 (94.9%) cases, and as inadequate in 58 (5.1%) cases. The colonoscopy quality measures (ADR, CIR, and WT) are divided by periods in Table 1.
Comparison of quality indicators between the pre-intervention and feedback periods.
| Quality measure | Pre-intervention % (min-max) | Feedback % (min-max) | Postintervention % (min-max) | P value (pre- vs. feedback) | P value (pre- vs. post) |
|---|---|---|---|---|---|
| X ± SD | X ± SD | X ± SD | |||
| ADR | 59.1(23.5-62.5) | 54.6 (46.9-69) | 49 (37.2-65.7) | .34 | .89 |
| 51.1 ± 16.1 | 57.5 ± 8 | 50.7 ± 10 | |||
| CIR | 100 (89.8-100) | 95.6 (81-100) | 100 (86.6-100) | .068 | .1 |
| 97.6 ± 4.4 | 94.1 ± 6.3 | 96.4 ± 5.1 | |||
| WT | 15.7 (14-24.4) | 17.4(13.1-20.2) | 14.5 (13.6-17.3) | .68 | .22 |
| 17.3 ± 4.2 | 16.7 ± 2.6 | 14.8 ± 1.2 |
ADR: adenoma detection rate; CIR: cecal intubation rate; WT: withdrawal time; X ± SD: mean ± standard deviation.
The overall ADR of the group moved from 51.1% (95% CI 35.9-60.7) in the preintervention period to 57.5% (95% CI 54.3-65.9) during the feedback period, and 50.7% (95% CI 46.3-60.9) in the post-intervention period. Almost all the endoscopists were cataloged as “high detectors” at the beginning and remained “high detectors” at the end of the study. Only one endoscopist started as a “low detector” and was the case that exhibited the most significant ADR improvement from 23.5% to 61.5% in the postintervention period (P < .001) (Fig. 1).
.")
The median of the CIR in the pre-intervention period was 100% (95% CI 89.8-100) vs. 95.6% (95% CI 81-100) in the intervention period and 100% (95% CI 86.6-100) in the post-intervention period. For the WT, the medians (in minutes) with the 95% CIs were 15.7 (14.5-21) vs. 17.4 (14.6-19.4) vs. 14.5 (13.5-16.3).
DiscussionIn our study, quarterly feedback during division meetings and email reports did not significantly improve colonoscopy quality measures. In the ADR, the impact of the intervention was most prominent in “low detectors.” The inconsistency in achieving the recommended goals in CIR is remarkable.
Maneuvers to improve the quality of colonoscopy have been evaluated with discordant results, and in the best scenario, improvement in ADR has been modest.16 In our study, the overall ADR of the group increased from 51.1% in the pre-intervention period to 57.5% (relative increase of 12.5%; delta 6.4%) during the feedback period and decreased to 50.7% in the post-intervention period. One proposed explanation for this temporary association is the Hawthorne effect, wherein the behavior of study participants is altered simply because of their knowledge of being monitored.17 This phenomenon could explain the ADR improvement after feedback and the decrement during the later phase of the study.18 In a recent meta-analysis, the pooled ADR before feedback was 30.5%, with an after-feedback ADR of 36.0%.16 However, in the study by Kahi et al.,19 in the intervention phase, the ADR was significantly higher (44.7%; 95% CI 39.1-50.4 vs. 53.9%; 95% CI 49.7-58.1) with a P = .013.
The improvement in the ADR of low performers relative to high performers was evident, which suggests that feedback on one’s performance relative to one’s peers is essential. Of the gastroenterologists included in this study, five out of seven endoscopists had a baseline detection rate higher than 50%, and further increases were unlikely because of the ceiling effect (Fig. 1).
A lower CIR is associated with a diminished detection of neoplasia, higher incidence of interval CRC, and added cost and logistical complexity due to the need for repeat colonoscopy or alternative testing.20,21 A relevant finding in our study was that even when the ADR was generally achieved, the CIR differed. In 6 of the 21 CIRs measured, the recommendations still needed to be completed (Fig. 1). It is important to note that the low detector (in the case of ADR) always had a CIR within the guideline recommendations,22 and the endoscopists with a low CIR always had an ADR above 50% (Fig. 1). To the best of our knowledge, there are no data about whether reaching one of the parameters is more relevant than another. Some maneuvers to improve the CIR have been evaluated,23,24 but we have yet to find information specifically directed toward assessing the impact of staff meeting or email feedback on the CIR.
The limitations of our study need to be mentioned. The study is from a single center with a small number of endoscopists. However, most of the previous reports have similar numbers. In a meta-analysis of 12 studies, almost 50% of them included data from 10 or fewer endoscopists.16 On the other hand, advantages of our study are the fact that we included a combination maneuver that has yet to be studied, such as the exposition of the group data in a department meeting and regular emails. These data are easy to show and discuss with participants, allowing better data compression. A different period could have a different result, and considering the low cost of the maneuver, its evaluation in a further study is very feasible. Our impression is that in high detectors, as in most maneuvers, the frequency of the report (in regular meetings or by email) is irrelevant. However, if you have low or perhaps even average detectors, reporting the quality metrics, despite the frequency, positively impacts their performance. It is essential to have periodic monitoring of QIs in colonoscopy to detect the low detectors since they are the ones that benefit from the intervention.
In conclusion, quarterly feedback and email reports did not significantly improve QIs in colonoscopies. Concerning the ADR, the intervention’s impact was most prominent in low detectors.
CRediT authorship contribution statementProtocol design: FTA and BB; Manuscript draft: FTA, BT, MG; Data collection and processing: FTA and BB; Original draft: FTA; Final review, editing, and agreement: all the authors.
Financial disclosureAll the authors declare that no financial support was received in relation to this study/article.

