Endoscopic ultrasound (EUS)-guided fine-needle aspiration biopsy (FNAB) is the gold standard for determining lymph node involvement with diagnostic accuracy > 95%,1 even though it cannot be carried out passing the needle through the primary tumor or vascular structures, and it can be technically difficult. Four conventional criteria characteristic of malignant lymph nodes (LN) utilizing EUS in mode B are: > 1cm, rounded, hypoechoic, and sharp margins; however, the sensitivity (Sn) and specificity (Sp) of these criteria in distinguishing malignancy exceed 80% only when all of them are present.2 Elastography (EG) is applied in real time during EUS (EUS-EG) and it evaluates tissue elasticity and hardness. Clinical research has shown favorable results in the differentiation between benign and malignant tissues.3,4 EG utilizes a color map (red-green-blue) in the region of interest (ROI) and can be qualitative and quantitative. The blue areas indicate hard tissue, green and yellow indicate intermediate hardness, and red indicates soft tissue.5 Qualitative EUS-EG is determined through color patterns and has demonstrated an overall accuracy of 88.1% in detecting LN malignancy.3 Quantitative EUS-EG utilizes second-generation software, is more objective, and enables stiffness quantification by comparing 2 different tissue zones (A and B) of the ROI. Area A includes the greatest surface area of the tissue being studied and area B is a reference surface of normal adjacent tissue that is in red. The A/B coefficient determines the strain ratio (SR).6 The reported diagnostic accuracy for determining LN malignancy is 90%.7
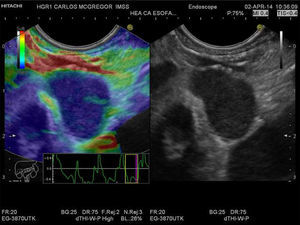
The aim of this communication was to show the application of quantitative EG. We present herein the clinical case of a 54-year-old man referred for locoregional staging of squamous cell carcinoma in the distal third and middle third of the esophagus. We used a multi-frequency electronic linear echoendoscope (EG-3870UTK, Pentax Medical Company, Tokyo, Japan) and a console with elastography (AVIUS E 3.5 Hitachi Medical Corporation, Tokyo, Japan). We conducted a conventional exploration in mode B, identifying 2 distal paraesophageal LNs (station 8) and a third lymph node in the celiac axis that measured 10.2 x 6.7mm, 16.9 x 11mm, and 15.9 x 9mm, respectively; they were oval, hypoechoic, and had well-defined margins. We activated the EG, observing a conventional mode B gray-scale image at the right of the monitor and the same image with superimposed elastography on the left side. Through transducer compression supported by the strain graph, and taking the respiratory and vascular movements into consideration, a stable image was achieved for approximately 5seconds; with the frame average option we obtained a better photogram, observing a homogeneous blue pattern in the 3 lymph nodes (fig. 1). We subsequently determined the SR and area A (the greatest LN surface area possible) and area B (red normal adjacent tissue surface) were selected from the photograms obtained (fig. 2) with values of 9.83, 19.2, and 13.2, respectively. FNAB of the celiac lymph node was performed with a 22 G needle (ExpectTM Boston Scientific), guided by Doppler ultrasound (fig. 3). This passage was evaluated by a cytopathologist who determined it was an adequate sample and the definitive cytologic result was metastatic squamous cell carcinoma (fig. 4). Locoregional staging was T3 (invasion of the adventitia with no involvement of the adjacent structures) N2 (3 lymph nodes, including the celiac lymph node) (AJCC 2010/NCCN2013).
Qualitative EUS-EG of the paraesophageal lymph node. A lymph node that is > 1cm, oval, hypoechoic, and with well-defined margins can be observed in the gray-scale image in the right window. The same image is shown in the left window, but with superimposed elastography that shows the homogeneous blue pattern (type 3). The strain graph with a yellow rectangle from the frame average option can be seen.
Quantitative EUS-EG of the celiac lymph node. Strain ratio (SR) measurement is shown in the left window. The two areas within the yellow circles correspond to area A (the greatest possible lymph node surface area) and area B (normal adjacent tissue in red); they are shown as percentages at the lower portion of the film. The calculated SR is shown as B/A to the lower right.
Cytology obtained through fine-needle aspiration biopsy. a) Panoramic view with three-dimensional conglomerates of overlapping cells. b) The close-up shows syncytium cells with overlapping and nuclear hyperchromasia, scant cytoplasm, thick and coarse chromatin, as well as some atypical mitoses and moderate anisokaryosis.
Giovannini et al.3 reported a Sn of 91.8% and Sp of 82.5% with qualitative EUS-EG for differentiating benign and malignant LNs utilizing 5 patterns: 1, homogeneous green (normal); 2, heterogeneous green, yellow, and red (fibrosis or inflammation); 3, mixed or honeycomb (hard and soft and difficult to interpret); 4, green central area surrounded by blue (hypervascularized malignancy); and 5, blue with heterogeneous green and red (necrosis in advanced malignant lesion). However, the number of patterns and the mixed pattern are a limitation. Knabe et al.8 obtained a Sn of 100% and a Sp of 64.1% utilizing only 3 patterns: 1, homogeneous green (benign); 2, mixed image, a blue focal area with a predominance of green (focal areas of neoplasia); and 3 homogeneous blue (malignant). In the present case, the 3 lymph nodes had a malignant pattern.
Paterson et al.7 reported a Sn of 83% and a Sp of 96% with the quantitative EUS-EG for differentiating benign and malignant LNs and they determined the SR with an optimal cut-off point ≥ 7.5, which was better, compared with the conventional criteria. A previous study described a cut-off point of 3.81.9 This technique eliminates the limitations of qualitative EG. In the present case, we obtained an SR > 7.5 in the 3 LNs and therefore the qualitative and quantitative EUS-EG diagnosed malignancy that was corroborated by FNAB in the celiac lymph node. The other lymph nodes were not susceptible to biopsy because it would have been necessary to pass through the primary tumor. Larsen et al.10 reported that the conventional criteria had a higher Sn, but EG had a higher Sp. Currently, the combination of the conventional criteria and EG can be used to avoid performing EUS-FNAB in LNs that are considered likely to be benign, and as an alternative in those cases in which EUS-FNAB is contraindicated. The application of this technique and the obtainment of reliable images require experience.
Conflict of interestThe authors declare that there is no conflict of interest.
Financial disclosureNo financial support was received in relation to this study/article.
Please cite this article as: Ramírez-Ramírez MA, Martínez-García CL, Zaragoza-Serna I, Zamorano-Orozco Y. Elastografía cuantitativa por ultrasonido endoscópico en la estadificación ganglionar del cáncer de esófago. Revista de Gastroenterología de México. 2014;79:296–299.


