


In recent years, probiotics have been used in functional gastrointestinal disorders, including chronic constipation (CC). The effect of Bifidobacterium infantis strain 35624 on the gut microbiota of CC patients has not been previously studied.
Our aim was to analyze the fecal microbiota of constipated patients, before and after consuming a single-strain probiotic (B. infantis strain 35624).
Materials and methodsWe used 16S rRNA gene high-throughput sequencing to analyze the fecal microbiota of female patients (n=13) with CC. Patients were instructed to ingest one capsule of Alflorex® (containing 1×10⁹ CFUs/g B. infantis strain 35624) daily for eight weeks. Fecal samples were obtained at the baseline and end (final) of probiotic administration.
ResultsAlpha diversity metrics did not differ between the baseline and final periods. The butyrate producer, Oscillospira, was the taxon most strongly correlated with amplicon sequence variants (R2=0.55, p<0.0001). Except for a few bacterial taxa, there were no significant differences in relative abundance between the baseline and final periods. Beta-diversity measures also showed limited evidence for the differences between the two time periods.
ConclusionsThe results suggest that the fecal bacterial microbiota remains stable in constipated women consuming a single-strain probiotic. Those findings may be helpful in better understanding probiotic functioning in patients with digestive disorders.
En los últimos años, los probióticos se han utilizado en trastornos gastrointestinales funcionales, incluido el estreñimiento crónico (EC). El efecto de la cepa 35624 de Bifidobacterium infantis sobre la microbiota intestinal de pacientes con EC no se ha estudiado previamente.
Nuestro objetivo fue analizar la microbiota fecal de pacientes estreñidos antes y después de consumir un probiótico de una sola cepa (B. infantis cepa 35624).
Material y métodosUsamos secuenciación de alto rendimiento del gen 16S ARNr para analizar la microbiota fecal de pacientes mujeres (n=13) con EC. Se indicó a los pacientes que consumieran una cápsula de Alflorex® (con 1×10⁹ UFC/g de B. infantis 35624) al día durante ocho semanas. Se obtuvieron muestras fecales al inicio del estudio y al final de la administración de probióticos.
ResultadosLas métricas de diversidad alfa no fueron diferentes entre la línea de base y la final. El productor de butirato Oscillospira fue el taxón más fuertemente correlacionado con las variantes de secuencia de amplicones (R2=0.55, p<0.0001). Excepto por unos pocos taxones bacterianos, no hubo diferencias significativas en la abundancia relativa entre la línea de base y la final. Las medidas de diversidad beta también mostraron evidencia limitada de diferencias entre los dos períodos de tiempo.
ConclusionesLos resultados sugieren que la microbiota bacteriana fecal permanece estable en mujeres estreñidas que consumen un probiótico de una sola cepa. Estos hallazgos pueden ser útiles para comprender mejor el funcionamiento de los probióticos en pacientes con trastornos digestivos.
The human digestive tract is home to millions of highly competitive microorganisms (known as the gut microbiota) that live in intimate symbiosis with the host1. The gut microbiota plays a vital role in regulating and maintaining health in the digestive tract and in extraintestinal organs2. It is important to investigate the characteristics of that symbiosis to better understand human health and well-being.
The first studies that investigated the microbes in the gut and other organs showed that they varied widely among healthy individuals but were relatively stable over short periods of time3. However, other studies suggested a pronounced temporal variability in the healthy human microbiome, even across days4. That variation is particularly relevant in clinical settings, for example, in patients with gastrointestinal disorders or in those receiving antibiotics5,6.
Chronic constipation (CC) is a highly prevalent intestinal disorder characterized by hard stools and/or a feeling of incomplete evacuation7. Different treatments are recommended to alleviate those symptoms, including the use of probiotics (i.e., live beneficial microorganisms). Some of the mechanisms by which probiotics may improve health in constipated patients include an alteration of the gut microbiota and regulation of the intestinal environment, such as a reduction in luminal pH. Several randomized trials have been performed on the use of probiotics (mostly strains of Lactobacillus and Bifidobacterium) in CC7, with varied clinical success. A recent meta-analysis of randomized trials concluded that consumption of probiotics may reduce gut transit time, increase stool frequency, and improve stool consistency in adults with functional constipation8. However, the authors also reported a wide variation in performance among the trials. The reasons for said variation may involve differences between patient populations, as well as in the performance of the probiotics9.
The use of Bifidobacterium as a probiotic is well documented in patients with functional gastrointestinal disorders but it has also shown mixed results. Dimidi et al.10 reported that a 4-week supplementation with 1.5×10¹⁰ colony-forming units (CFUs) of one strain of B. lactis was not effective in the management of CC, in a randomized trial with 75 participants. In that study, the authors also analyzed the gut microbiota, but only used quantitative real-time PCR (qPCR), which is useful for monitoring individual taxa but is unable to fully characterize microbial communities. Another study investigated the effect of 8-week supplementation with 1×10⁹ CFUs of B. infantis strain 35624 in the fecal microbiota of patients with irritable bowel syndrome (IBS)11. That study showed increased excretion of the administered probiotic for the duration of treatment, with disappearance shortly after it was discontinued. However, the authors also used qPCR for a few selected taxa only, and rightfully concluded that given the complex spectrum of the gut microbiota, changes or differences in selected taxa are not a useful indicator of probiotic function. The aim of the present study was to analyze the fecal microbiota of constipated patients, before and after consuming the single-strain probiotic, B. infantis 35624.
Materials and methodsPatient enrollmentWe recruited patients with CC from the Port of Veracruz, Mexico, in this open-label study. Inclusion criteria were: >18 years of age, self‐reported stool frequency of 3 or fewer bowel movements per week, self‐reported stool consistency of type 1-4 on the Bristol Stool Form Scale, and fulfilment of the Rome IV diagnostic criteria for functional constipation12,13.
Patients that were receiving pharmacologic treatment were asked to withdraw treatment for at least one week, so they could be evaluated. Exclusion criteria were gastrointestinal and other disorders likely to affect gut motility; prior abdominal surgery; ongoing therapy with medications known to affect gut motility; secondary causes of constipation; dyssynergic defecation; colonic inertia; anorectal problems; lactose intolerance, cow’s milk and soy allergy; regular consumption of probiotics, prebiotics, fiber supplements, and laxatives; antibiotic use within 4 weeks of study onset; and ongoing alcohol, drug, or medication abuse. The prevalence of constipation is almost twice as common in females, therefore we decided to only include women, to avoid potential confounding factors.
Patients were instructed to ingest one capsule of Alflorex® containing 1×10⁹ CFUs/g B. infantis strain 35624 daily, for a consecutive period of 8 weeks, while continuing their regular dietary habits. B. infantis 35624 is also known as B. longum subsp. infantis (https://www.precisionbiotics.com/es/), but in addition, has been (more precisely) catalogued as B. longum subsp. longum (the original misassignment resulted from the sole use of the partial 16S rRNA-based taxonomic classification)14. The probiotic was donated by the Menarini Mexico company (Mexico City, Mexico), which only provided the drug and did not intervene in the study design or the result analysis.
Patients were informed that they were being invited to participate in a study whose aim was to investigate the effect of a probiotic on their symptoms and the composition of gut microbiota, without explicitly promising a beneficial effect. Considering the amount of product in each capsule (247 mg) and the concentration of the probiotic (1×10⁹ CFUs/g), each capsule provided 2.47×10⁸ CFUs. Patients filled out a questionnaire regarding clinical parameters, such as stool consistency, self-perceived bloating intensity, and days without symptoms, at the baseline and the end (final) of probiotic administration. Stool consistency was assessed by the patients using the Bristol scale15, in which 1 represents hard lumps, and 7 represents watery stools. Self-perceived bloating intensity was expressed, using a visual analogue scale from 0 to 100. Global improvement was evaluated, using the overall symptom question: in the last 7 days, do you consider that you had adequate relief from your constipation symptoms? Patients were instructed to use 17 g daily of polyethylene glycol, on a regular basis if necessary, if rescue therapy was required.
Fecal sample collection and DNA extractionFecal samples were collected by the patients at home, at the baseline and end of probiotic administration. The samples were placed in coolers with frozen gel packs and brought to our laboratory within one hour, where they were placed at –20°C, until processing. Because the homogenization of feces prevents the accurate evaluation of microbial communities16, we thawed the samples and obtained the aliquots for analysis, mostly from the middle of the fecal material available from each sample17. Total genomic DNA was obtained and purified from one aliquot (100 mg) from each fecal sample, using bead-beating, coupled with a commercial DNA extraction kit (Wizard® Genomic DNA Purification Kit Protocol, Promega Corporation, Madison, Wisconsin, USA). Two separate aliquots from the baseline sample from the last patient (sample ID: S19) were processed to assess the replicability of the procedure. The DNA samples (n=27, 26 from the 13 patients plus one duplicate from S19) were adjusted to 150ng/μl and shipped to Molecular Research LP (Shallowater, Texas, USA). PCR was carried out to amplify a semi-conserved region of the 16S rRNA gene using primers 515F (GTGYCAGCMGCCGCGGTAA) and 806R (GGACTACNVGGGTWTCTAAT). High-throughput DNA sequencing of the PCR amplicons was performed in a MiSeq instrument (Illumina, San Diego, California, USA), as described elsewhere18. Unless otherwise stated, only the results for the 13 sample pairs (n=26), using the first replicate of sample S19, are shown and discussed.
Bioinformatics and statisticsWe used different tools in QIIME219 v.2020.2 to analyze the sequencing data, employing default parameters, unless otherwise mentioned. The sequencing laboratory provided free taxonomic assignment, using a curated database, but the results are only mentioned in the context of our taxonomic assignment in QIIME2, using the Greengenes 13.8 database. The phylogenetic method, UniFrac20, was used for comparing microbial communities, with both weighted and unweighted distances21.
It is common practice to analyze the different bacterial taxa separately. However, that approach is not necessarily better for understanding microbial fluctuations in complex ecosystems, where different types and numbers of microbes coexist. Therefore, we used the SAS® University Edition (SAS Institute, Cary, North Carolina, USA) to perform the multivariate analysis for different taxa at the same time. When needed, the Wilcoxon signed-rank test was used to compare variables (e.g., relative abundance of bacteria) between both periods of time (baseline and final). We also performed correlation analyses using the baseline and final values for the individual taxa, as well as between the different combinations of the time points and taxa (e.g., baseline values for taxa A vs. final values for taxa B), to investigate any relationship that could impact microbe variability over time. Plots were produced using SAS and PAST v.3.25.
Ethical considerationsA written statement of informed consent was required for participation in the present study. All procedures were carried out in accordance with the WHO code of ethics (Declaration of Helsinki) and approved by the local ethics committee of the Institute for Medical Biological Research (Universidad Veracruzana, 2018-013R). The authors declare that this article contains no information that can identify the patients.
ResultsPatientsNineteen female patients were included, but only 13 were able to complete the protocol (Table 1). Prior to the study, 3 patients were not taking any medication or supplements to treat their constipation, 6 were on fiber supplements, and 11 used laxatives (6 polyethylene glycol, 3 lactulose).
Baseline characteristics of all 13 female patients that completed the protocol.
| Subject ID | Age range | Body mass index | Self-perceived percentage of distension intensity (baseline/final) |
|---|---|---|---|
| S01a | 50-60 | 27.3 | 50/0 |
| S02a | 50-60 | 25.5 | 100/25 |
| S06a | Over 60 | 28.2 | 75/0 |
| S07a | Over 60 | 25.2 | 75/50 |
| S08a | 30-40 | 33.7 | 100/90 |
| S09a | 30-40 | 25.9 | 75/50 |
| S10 | 50-60 | 25.5 | 25/50 |
| S11 | 40-50 | 25.5 | 65/75 |
| S14 | 40-50 | 27.1 | 50/NR |
| S15 | 50-60 | 20.0 | 25/25 |
| S16a | 50-60 | 25.2 | 75/25 |
| S18a | 50-60 | 37.6 | 50/10 |
| S19 | 40-50 | 29.7 | 100/100 |
NR: not recorded and therefore not included in the statistical comparison.
Six of the 13 enrolled patients (46%) reported an improvement on the Bristol stool scale of more than 50%, compared with the baseline, and 10 of the 13 patients (77%) reported overall symptom improvement. Bloating intensity was significantly lower, after probiotic administration (67% vs. 42%, p=0.02) (Table 2), and the percentage of time (in days) without symptoms was also lower after the probiotic (49% vs. 39%), but the difference was not significant (p=0.48). Only 2 patients reported taking the rescue medication, intermittently. However, those results are likely to have limited clinical relevance due to a possible placebo effect and lack of a control group.
Average relative proportions of the 16S rRNA sequences for some of the most abundant taxa.
| Taxon | Baseline | Final | p value | Patients that experienced an increase/decrease |
|---|---|---|---|---|
| Firmicutes | 66.8% | 54.2% | 0.28 | 6 (16.4%)/7 (35.6%)* |
| Blautia | 14.0% | 7.2% | 0.10 | 5 (5.8%)/8 (14.7%) |
| Clostridium | 8.4% | 8.9% | 0.86 | 6 (10.8%)/7 (8.1%) |
| Eubacterium | 6.9% | 6.3% | 0.51 | 4 (4.4%)/9 (2.8%) |
| Ruminococcus | 6.6% | 5.7% | 0.46 | 4 (7.6%)/9 (4.7%) |
| Turicibacter | 9.1% | 3.3% | 0.46 | 7 (4.2%)/6 (17.4%) |
| Bacteroidetes | 12.2% | 18.3% | 0.38 | 8 (17.6%)/5 (12.3%) |
| Bacteroides | 3.5% | 6.1% | 0.65 | 9 (6.9%)/4 (6.9%) |
| Prevotella | 3.9% | 5.2% | 0.75 | 7 (5.9%)/6 (4.3%) |
| Cyanobacteria | 10.9% | 9.9% | 0.92 | 7 (8.6%)/6 (11.9%) |
| Halospirulina | 10.8% | 9.9% | 0.92 | 7 (8.6%)/6 (11.9%) |
| Proteobacteria | 3.2% | 10.1% | 0.01 | 11 (8.5%)/2 (2.5%) |
| Alphaproteobacteria | 0.5% | 2.1% | 0.70 | 7 (3.7%)/6 (0.8%) |
| Betaproteobacteria | 0.9% | 0.4% | 0.70 | 8 (0.6%)/5 (2.3%) |
| Deltaproteobacteria | 0.01% | 1.3% | 0.02 | 10 (1.6%)/3 (0.005%) |
| Epsilonbacteria | 0.007% | 0.6% | 0.03 | 9 (0.8%)/4 (0.003%) |
| Gammaproteobacteria | 1.8% | 5.7% | 0.03 | 10 (5.5%)/3 (1.6%) |
| Stenotrophomonas | 1.4% | 4.2% | 0.60 | 7 (6.3%)/6 (1.1%) |
| Kopriimonas | 0.2% | 1.9% | 0.92 | 6 (3.9%)/7 (0.3%) |
| Pseudomonas | 0.02% | 0.7% | 0.02 | 10 (0.8%)/3 (0.02%) |
| Actinobacteria | 6.1% | 3.9% | 0.42 | 6 (2.1%)/7 (5.8%) |
| Bifidobacterium | 4.2% | 2.7% | 0.42 | 5 (1.3%)/8 (3.3%) |
| Verrucomicrobia | 0.8% | 3.4% | 0.17 | 8 (4.7%)/5 (0.5%) |
| Akkermansia | 0.7% | 3.4% | 0.10 | 8 (4.7%)/5 (0.5%) |
The taxa are organized by phylum (in bold font to aid visualization). The p values come from the Wilcoxon test.
After demultiplexing, we obtained 2,069,625 16S sequences from 27 fecal samples (mean: 76,652 sequences/sample, min: 25,964, max: 170,946). The use of DADA222 for quality filtering yielded a total of 1,868,215 sequences (∼90% of the original), using 280 nucleotides as the truncating length.
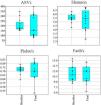
Alpha diversityUsing a rarefaction depth of 24,000 sequences/sample, DADA2 revealed the presence of 1,123 amplicon sequence variants (ASVs) that belonged to 120 genera from 16 phyla. There were no significant differences in the number of ASVs, Shannon diversity values, Pielou’s evenness values, and Faith’s phylogenetic diversity values (Fig. 1). With the exception of Faith’s phylogenetic diversity values, there was a noticeable dissimilarity in the spread of the samples, between the baseline and final periods (Fig. 1).

Boxplots with jitter showing alpha diversity metrics. There was no statistically significant difference between the baseline and final periods, but the values from most metrics showed a higher variation after probiotic use. The plots were constructed in PAST v. 3.25. ASVs: amplicon sequence variants.
A total of 99.3% of the 16S reads could be classified into a given phylum, but only 63% were assigned to a given genus. That percentage is not uncommon23, but most research articles prefer not to declare the percentage of reads assigned to the different taxonomic levels. Seven phyla accounted for ∼99% of all reads (Firmicutes: 55.8%, Bacteroidetes: 15.0%, Cyanobacteria: 10.2%, Tenericutes: 5.4%, Proteobacteria: 5.3%, Actinobacteria: 4.9%, and Verrucomicrobia: 2.0%). Those results partially agreed with the results provided by the sequencing laboratory that uses a different database for taxonomic assignments (Firmicutes: 60.6%, Bacteroidetes: 15.5%, Cyanobacteria: 10.3%, Proteobacteria: 6.5%, Actinobacteria: 4.9%, and Verrucomicrobia: 2.0%), with the exception of Tenericutes, which only accounted for 0.003% of all reads. With few exceptions, the variation in relative abundance of taxa between the two replicates of baseline sample S19 was lower, compared with the variation between the baseline and final values for all sample pairs.
The relative abundance for each phylum revealed a high inter-individual variation, as well as a wide difference in the variation over time for each subject (Fig. 2), as shown elsewhere. For instance, 7 of the 13 patients (54%) experienced a decrease in the relative abundance of Firmicutes of 37%, on average, whereas 6 of the 13 patients (46%) showed an increase in that taxon of 16%, on average (Table 2). In other words, the change in Firmicutes over time occurred in a similar proportion of patients (54% vs. 46%), but the change was more pronounced (37% decrease vs. 16% increase) in the patients that experienced a decrease in said taxon. Regardless, the difference in Firmicutes between the two time periods did not reach statistical significance (p=0.28). In the case of Bacteroidetes, 5 of the 13 patients (38%) showed a decrease in that taxon of 12%, on average, whereas 8 of the 13 patients (62%) showed an increase of 18%, on average (Table 2). The difference in Bacteroidetes between the two time points did not reach statistical significance, either (p=0.38) (Table 2). Two patients showed a small decrease in Proteobacteria (from 7.4% to 2.6%, and from 1.97% to 1.94%, respectively) after probiotic administration, whereas the other 11 patients showed an average increase of 8.5% in the taxon (Fig. 2). The difference in Proteobacteria between the baseline (3.2%) and final (10.1%) periods was statistically significant (p=0.01), although it was mostly driven by two patients (Fig. 2) and was not clearly associated with any particular taxon (Table 2).
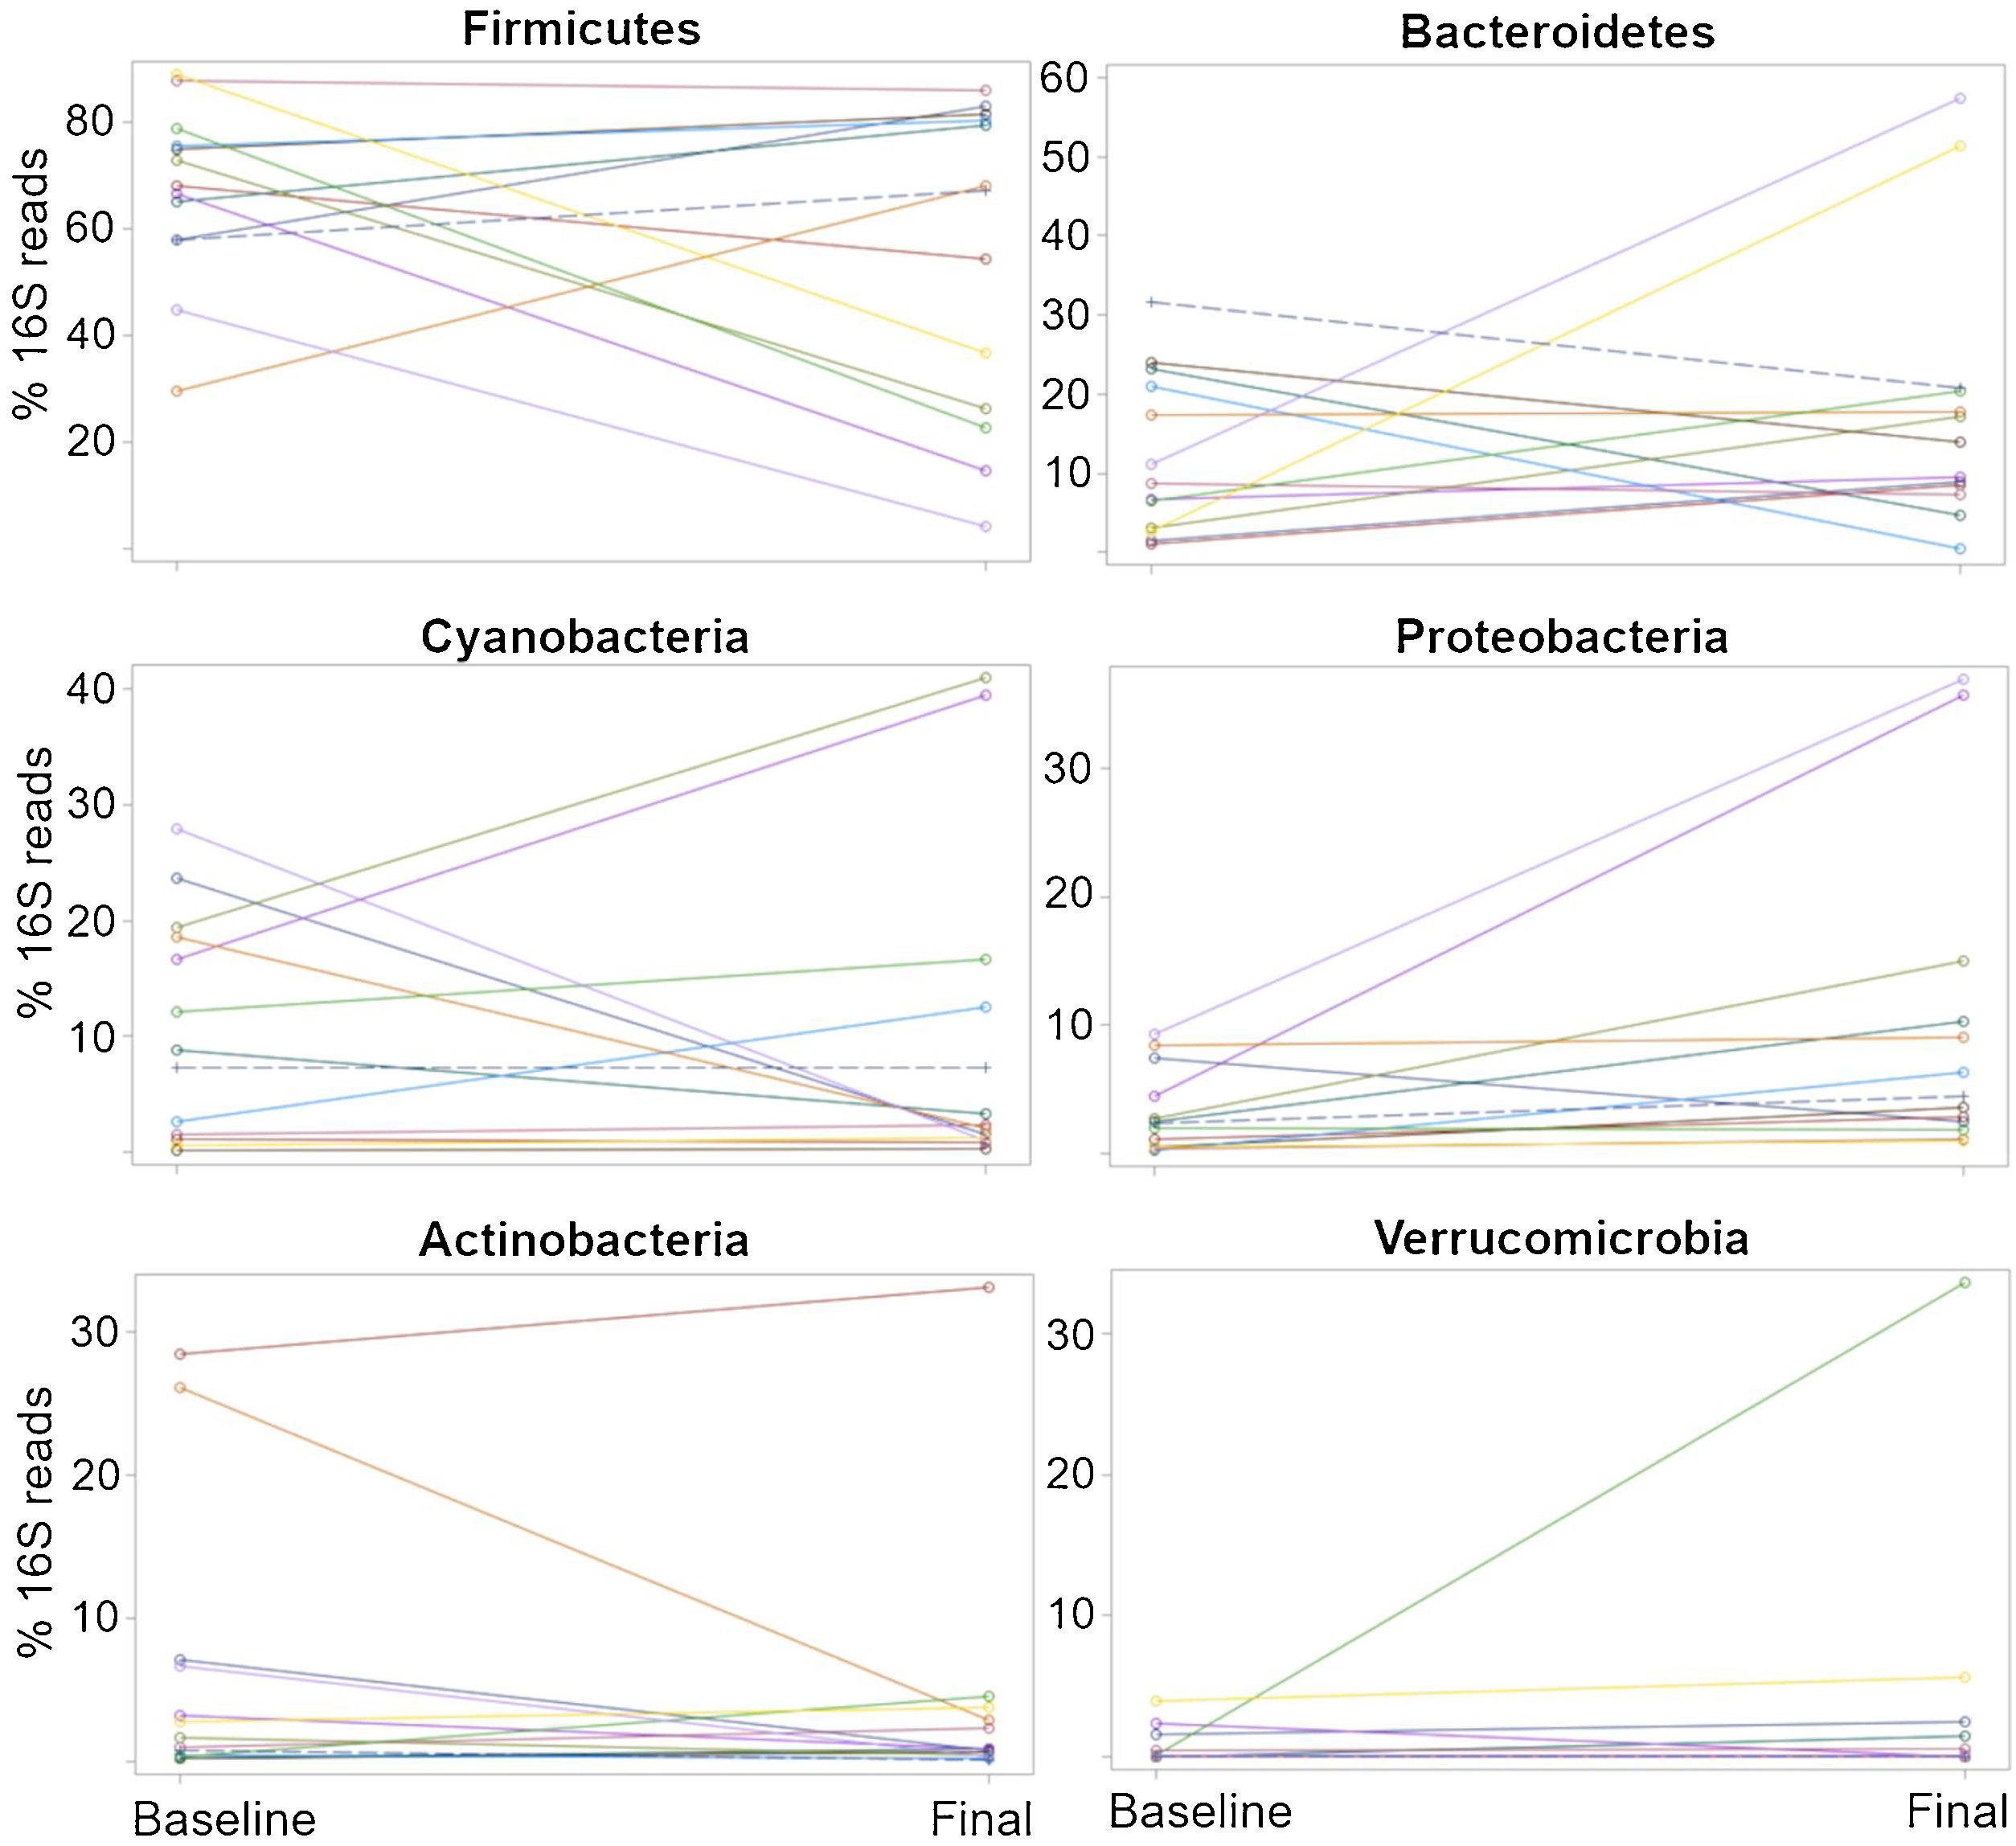
Percentages of the16S rRNA gene reads at the phylum level for all 13 patients at the baseline and the end (final) of probiotic administration. The purpose of this figure is to help visualize the high inter-individual variation (separation of dots within each time point), as well as a wide difference in the variation over time (change in the 16S reads from the baseline to the final periods) for each subject.
The plots were constructed in SAS.
The relative abundance of the genus Bifidobacterium was relatively high (the tenth most abundant genus) in our own analysis in QIIME2 (average 3.4%, min: 0.07%, max: 31.5%) and in the results from the sequencing laboratory (average 3.3%, min: 0.05%, max: 30.8%). We observed 9 ASVs that were related to Bifidobacterium, but most of them were low in abundance and showed low prevalence (Table 3).
Relative abundance and prevalence of all 9 Bifidobacterium ASVs.
| ASV taxonomy with percentage similarity | Baseline | Final | p value |
|---|---|---|---|
| B. adolescentis (98.8%) | 2.1% (13/13) | 1.4% (13/13) | 0.38 |
| B. adolescentis (99.3%) | 1.5% (13/13) | 1.1% (13/13) | 0.46 |
| B. longum (100%) | 0.6% (13/13) | 0.2% (12/13) | 0.08 |
| B. adolescentis (99.2%) | 0.07% (12/13) | 0.05% (11/13) | 0.81 |
| B. adolescentis (99.2%) | 0.01% (7/13) | 0.008% (6/13) | NA |
| B. breve (69.6%) | 0.0004% (2/13) | 0.002% (1/13) | NA |
| B. adolescentis (95.7%) | 0.0002% (2/13) | 0.004% (1/13) | NA |
| B. adolescentis (94.5%) | 0.0002% (2/13) | 0.0002% (2/13) | NA |
| B. breve (69.6%) | 0.003% (1/13) | 0.003% (1/13) | NA |
p values come from the Wilcoxon test.
ASVs: amplicon sequence variants; NA: comparison not applicable.
We used the relative abundance of the 16S reads from the 6 most abundant phyla, in different combinations, to find the lowest value for the Wilks’ lambda. Accordingly, the combination of 3 phyla (Firmicutes, Proteobacteria, and Verrucomicrobia) was associated with the lowest value (supplementary table S1). This is interesting because it implies that the combination of those 3 taxa may be more precise for analyzing the differences between the two time points.
Correlation analysisThe relative abundance of Actinobacteria (R2=0.5, p=0.007) showed the strongest correlation between the baseline and final periods, but that was mainly driven by the data from one patient (supplementary table S2). The only other phylum that showed a trend for significance was Proteobacteria (R2=0.3, p=0.046, supplementary table S2). We also examined correlations between the different phyla at the different time points (supplementary table S3). Interestingly, there was an inverse correlation between the baseline values for Firmicutes and Proteobacteria (R2=0.73, p=0.0002), as recently shown in a study on milk microbiota24. Another interesting finding was the positive relationship between baseline Cyanobacteria and Proteobacteria (R2=0.82, p=2.4×10⁻⁵). Cyanobacteria are often considered contaminants, but Ley et al.25 raised the intriguing possibility that gut cyanobacteria may be descendants of non-photosynthetic ancestral cyanobacteria that adapted to life inside the digestive tract.
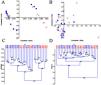
Beta diversityThe use of PCoA and UPGMA clustering on unweighted UniFrac distances suggested little variation in the two replicates from S19 and the presence of two clear clusters of samples that were partly explained by probiotic administration (Figs. 3A and C). Because of the possible existence of enterotypes (clusters of samples identifiable by the variation in the presence of specific taxa and their levels26), we removed the different taxa, one by one, to investigate whether the absence of a given taxon would explain that clustering. However, we found no evidence to suggest that the clustering was due to the presence (or absence) of any particular taxon. Interestingly, the two clusters of samples disappeared, when analyzing data from separate groups of selected taxa (e.g., Firmicutes, Proteobacteria, and Verrucomicrobia), but the significance of that finding is still unclear to us. Unlike the results regarding the unweighted UniFrac distances, the analysis of the weighted UniFrac distances showed a stronger separation of replicates from S19 but revealed no significant clustering of samples (Figs. 3B and D). Regardless of any visual clustering, the PERMANOVA test did not show any significant differences in the unweighted (p=0.12) or weighted (p=0.81) UniFrac distances.
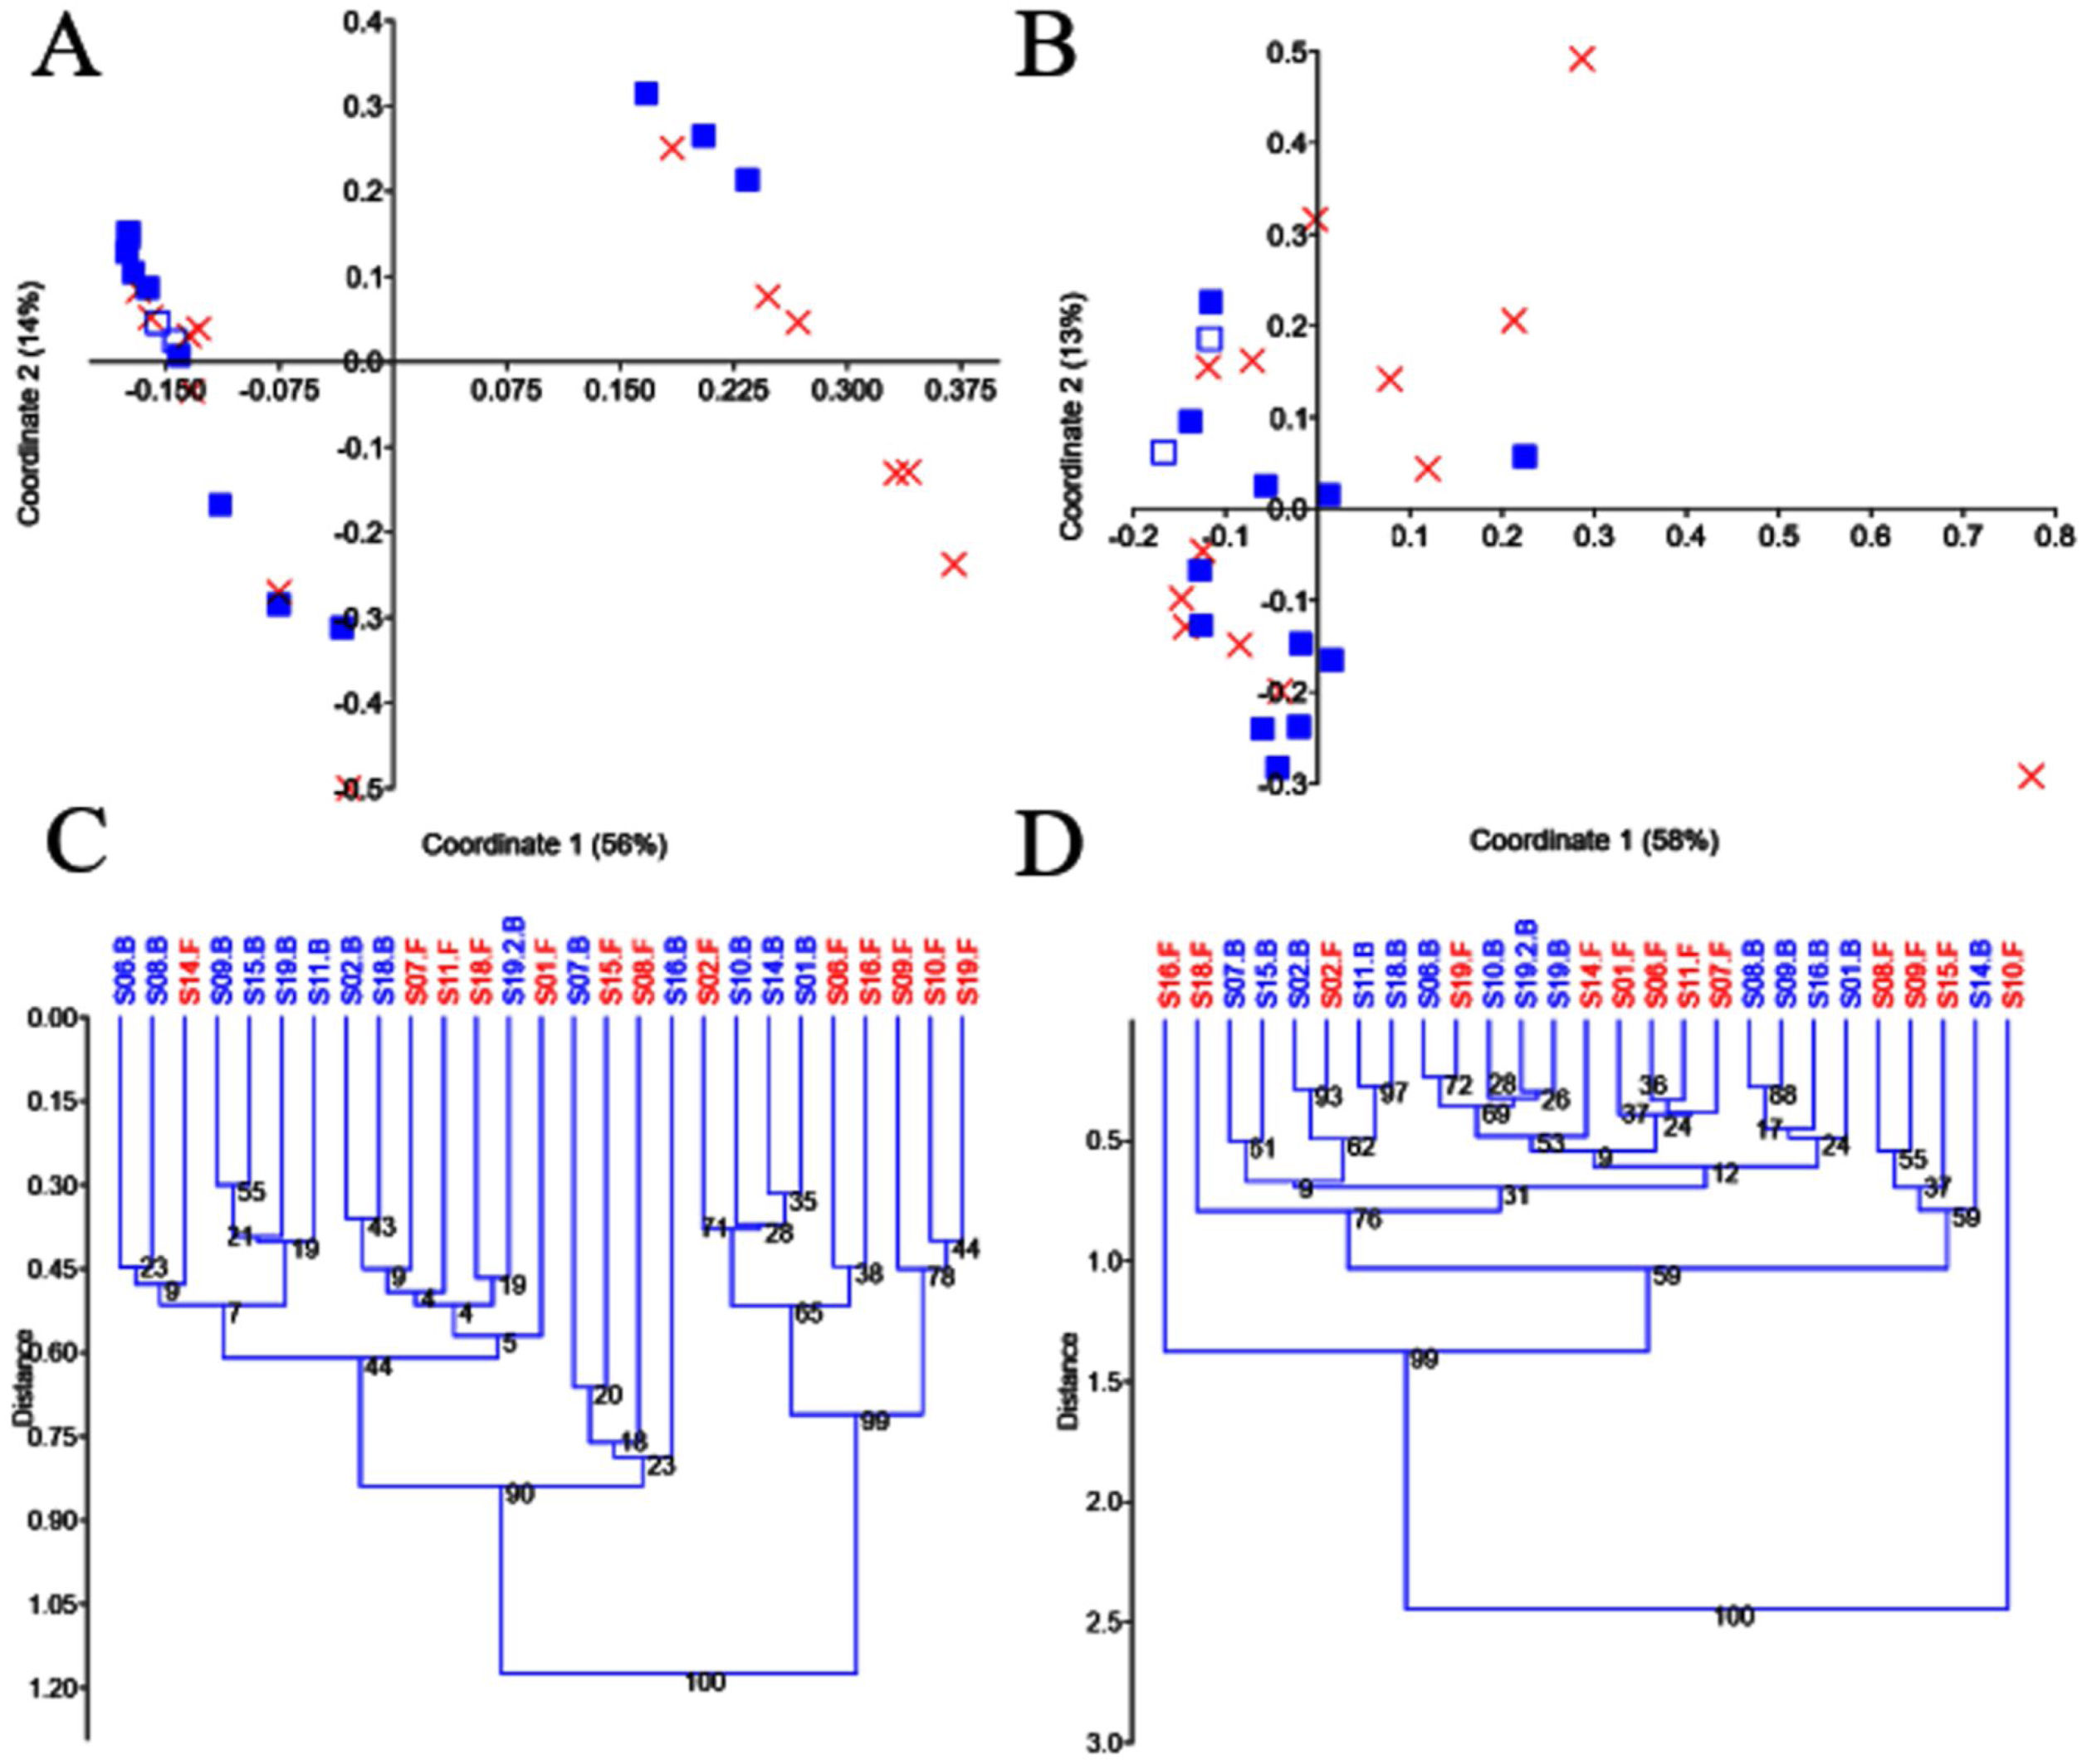
PCoA plots and UPGMA trees using unweighted and weighted UniFrac distances. PCoA plots using unweighted (A) and weighted (B) distances, UPGMA trees using unweighted (C) and weighted (D) distances. In A and B, the baseline samples are represented by filled blue squares, and the final samples by a red X. The sample that was processed in duplicate (S19, baseline) is shown, using a different symbol (empty blue squares) for better visualization. The trees were constructed using 10,000 bootstrapped samples. The Euclidean similarity index was used for all plots in PAST v. 3.25.
Body mass index and age were the only continuous variables associated with the patients and did not significantly explain the number of ASVs observed. Some of the taxa were related to the number of ASVs, particularly the butyrate producer, Oscillospira (R2=0.55, p<0.0001), an enigmatic member of Firmicutes (family Ruminococcaceae) from the human gut microbiota that has been shown to be positively associated with leanness and health27 (supplementary table S4).
Core microbiomeThe concept of core microbiome refers to the species (i.e., ASVs) that are present in the majority of samples in a given environment, for example, human feces. Few operational taxonomic units (OTUs) were shared by 50% of all samples (122 of 1,123, or 10.9% of all ASVs), baseline (153, 19.1%) or final (105, 12.3%) samples, implying that most ASVs were unique to each individual.
DiscussionThe gut microbiota is relevant in the pathogenesis and management of gastrointestinal disorders, including constipation28. In Mexico, CC has a prevalence between 2.4% and 22.3%29, representing approximately 3-27 million people. Although some studies have reported favorable results for probiotics in constipation, their clinical efficacy in alleviating symptoms remains controversial because of differences in methodological approaches, such as study populations (children, adults, older adults) and probiotic products (single vs. multispecies probiotics). Furthermore, only a few studies have explored the impact of probiotics on the composition and stability of the gut microbiota in constipated patients. The present study investigated the fecal microbiota of female patients with CC, after ingestion of a single-strain commercial probiotic.
Stools from constipated patients often appear to differ in water content, compared with stools from healthy individuals, and the physical change in stool consistency itself can have an impact on the composition and function of the gut microbiota30. However, stool consistency is difficult to contextualize with probiotic effectiveness due to the variations in cell size and volume of the gut microbiota, a topic that has not been properly discussed in the literature. Levin and Angert31 reported that the volume of common bacteria ranges from 0.4 to 3μm3 (or 0.4 to 3 femtoliters or fl; 1 ml=1×10¹² fl). Considering that 1 ml of wet feces weighs approximately 1g, then each mg of wet feces equals 1×10⁹ fl. If we consider that bacterial cells constitute approximately 150 mg of each gram of stools32, and take into account the volume ranges mentioned above, that implies that each gram of wet feces in healthy individuals can contain 5×10¹⁰ (considering a volume of 3 fl for each bacterial cell) to 3.8×10¹¹ (considering a volume of 0.4 fl) bacterial cells. In the event of 100% survival of all probiotics throughout the stomach and small intestine, the colonic gut microbiota of each patient in the present study would receive a daily dose of 2.47×10⁸ CFUs, or about 100 times fewer bacterial cell numbers than in 1 g of stools. In the case of a change in stool consistency (e.g., using the Bristol stool scale), it is then plausible to assume that the total number of autochthonous bacterial cells per gram of content would change, which could affect gut microbial biochemistry. Overall, constipation is a clinical condition that can affect microbial density and the resulting change may have other important health implications. This is an important but unexplored subject that deserves more investigation.
In addition to the concerns about stool consistency discussed above, there are other unknowns regarding the effect of probiotics in vivo, for example, the interaction with the resident commensal microbiome9 and other specific conditions encountered each day of probiotic consumption. For example, Vitali et al.33 suggested that intestinal colonization by probiotic bacteria may be higher in subjects having lower concentrations of those bacteria, before the ingestion of probiotics, whereas others have suggested the opposite34. In the present study, we found no significant relationships in microbial relative abundance between the baseline and final periods, although that could be due to the long (and clinically indicated) period of probiotic administration time. Nonetheless, the different spread of Pielou’s evenness values and other alpha diversity metrics after probiotic administration is interesting because others have shown a similar spread of those values, even from drastically different environments, such as the gut and tongue (QIIME2 tutorial ‘Moving pictures’ from data published by Caporaso et al.)4.
The term species is obviously inaccurate to classify bacteria into groups, and several efforts have been made to reach a consensus on bacterial names and classifications35. That quest for accurate identification of bacterial species, subspecies, and strains is particularly relevant in relation to the labeling of commercial products containing probiotics, for example members of Bifidobacterium36,37. This is important because the beneficial effects of probiotics are strain-specific, therefore not all members of the same species share the same properties. Bifidobacterium is a bacterial taxon that attracted increased attention in the last decades of the 20th century38. Several studies have used different species and strains of Bifidobacterium as probiotics39,40 but the contents claimed in the labels of commercial products are often inaccurate, with respect to both the types and numbers of the microorganisms41. To overcome some of those inconsistencies, we decided to use a commercial product that has been subjected to rigid quality control and contains a well-studied strain of Bifidobacterium that has been shown to exert immunoregulatory effects42,43.
The mechanism of action of probiotics in patients with gastrointestinal disease is a complex phenomenon to investigate. Several randomized, placebo-controlled trials have demonstrated the amelioration of IBS symptoms, including constipation, after the intake of B. infantis 35624 and other probiotics, but few studies have explored stability over time or discussed possible modes of action44,45. Falony et al.46 showed in vitro cross-feeding between one strain of B. longum and acetate-converting, butyrate-producing colon bacteria during growth on oligofructose. Fukuda et al.47 expanded those results and demonstrated that some strains of Bifidobacterium can protect against enteropathogenic infections through the production of acetate, which can contribute to butyrate formation48. That change in the gut biochemistry is ultimately related to a modulation of the composition of the intestinal microbiota, which could be evidenced by shifts in the relative proportions of fecal microorganisms, following probiotic supplementation. However, our results suggest that the consumption of B. infantis 35624 is not related with a change in the overall proportions of bacteria, at least in fecal samples. The case of Proteobacteria is of particular interest because that taxon showed a significantly different relative abundance between the baseline and final periods. Although Proteobacteria is often associated with negative effects on health, we and others have shown that some taxa within Proteobacteria could be beneficial, such as Pseudomonas18. Those results add valuable information to the probiotic literature, particularly in the context of microbial interactions in the gut of constipated patients, and they emphasize that the potentially beneficial effects of probiotics are more complex than a simple change in bacterial numbers or proportions.
Limitations of our study include the lack of a placebo group and the possibility that some patients may have skipped a few days without using the product. The self-perceived clinical response from probiotic administration was recorded, but the fact that the placebo effect is notoriously wide, particularly in open-label studies involving patients with intestinal functional disorders, should be noted. In addition, not only does every person have a different diet, but also a different dietary pattern that obeys personal preferences (e.g., homemade vs. commercial food) and other factors (e.g., work commitments), and treatment adherence was not strictly assessed. Lastly, we used fecal samples that do not necessarily reflect biologically significant changes in the mucus-associated microbiota, and we only used high-throughput sequencing to study the microbiota. Other molecular techniques, such as qPCR, could have confirmed the lack of significant changes for specific taxa.
ConclusionsThe present study showed minor differences in the fecal microbiota and several diversity parameters, before and after the administration of a single-strain probiotic in constipated female patients. Although limited conclusions can be drawn from this study, the results contribute to a better understanding of probiotic functioning in constipated patients consuming single-strain probiotic formulations.
Financial disclosureNo financial support was received in relation to this article.
Conflict of interestJ.M.R.-T. has received speaker’s fees, travel support, and participated in medical board meetings with Takeda Mexico, Asofarma, and Menarini. EMMQ has received consulting fees from Novo-zymes, speaker’s fees from Biocodex, and research support from 4D Pharma.
The remaining authors declare no conflict of interest.
The following is Supplementary data to this article:

Please cite this article as: Amieva-Balmori M, García-Mazcorro JF, Martínez-Conejo A, Hernández-Ramírez GA, García-Zermeño KR, Rodríguez-Aguilera O, et al. La microbiota bacteriana fecal en pacientes estreñidos previa y posterior a ocho semanas de administración diaria de Bifidobacterium infantis 35624. Revista de Gastroenterología de México. 2023;88:369–380.