

Liver fibrosis is a complication of metabolic dysfunction-associated steatotic liver disease (MASLD). Given the limitations and risks of liver biopsy, examining noninvasive scoring systems that are affordable for the population is necessary. Our aim was to evaluate and compare the diagnostic yield of the APRI, FIB-4, NAFLD score, and Hepamet fibrosis score instruments for detecting liver fibrosis in Mexican subjects with MASLD.
Material and methodsA retrospective study was conducted on a sample of subjects with MASLD. Liver fibrosis was calculated through transient liver elastography. Sociodemographic, epidemiologic, and biochemical variables were evaluated. Scores were calculated utilizing the fibrosis-4 (FIB-4) index, the aspartate aminotransaminase-to-platelet ratio index (APRI), the Hepamet fibrosis score (HFS), and the NAFLD score (NFS), and then compared. ROC curves were constructed, and the optimum cutoff points were determined utilizing the Youden index. Sensitivity, specificity, positive predictive value, negative predictive value, and likelihood ratio were calculated.
ResultsThe study included 194 subjects (63% women), of whom 150 (77.3%) were classified with MASLD and 44 (22.7%) as controls with no liver disease. There was a 15.3% prevalence of advanced fibrosis. The cutoff points of 0.57 for APRI, 1.85 for FIB-4, 0.08 for HFS, and −0.058 for NFS showed diagnostic yields with areas under the ROC curves of 0.79, 0.80, 0.70, and 0.68, respectively.
ConclusionThe APRI, FIB-4, NFS, and HFS scores are useful for evaluating liver fibrosis in Mexican subjects with MASLD. Better diagnostic yield was found with the FIB-4 and APRI scores.
La fibrosis hepática es una complicación de la enfermedad hepática esteatótica asociada a disfunción metabólica (MASLD). Dadas las limitaciones y los riesgos de la biopsia hepática, es necesario explorar sistemas de puntuación no invasivos y asequibles para la población. Nuestro objetivo fue evaluar y comparar el rendimiento diagnóstico de los puntajes APRI, FIB-4, NAFLD score y Hepamet para la detección de la fibrosis hepática, en individuos mexicanos con MASLD.
Material y métodosEstudio retrospectivo en una muestra de sujetos con MASLD. La fibrosis hepática se estimó mediante elastografía hepática transitoria. Se evaluaron variables sociodemográficas, epidemiológicas y bioquímicas. Se calcularon y compararon las puntuaciones: índice de fibrosis-4 (FIB-4), índice de la relación AST y plaquetas (APRI), Hepamet fibrosis score (HFS) y NAFLD score (NFS). Se generaron curvas ROC y se determinaron los puntos de corte óptimos usando el índice de Youden. Se calculó la sensibilidad, la especificidad, los valores predictivos positivos y negativos y las razones de verosimilitud.
ResultadosSe incluyeron 194 sujetos (63% mujeres), 150 (77.3%) fueron clasificados como MASLD y 44 (22.7%) como controles sin enfermedad hepática. La prevalencia de fibrosis avanzada fue del 15.3%. Los puntos de corte de 0.57 para APRI, 1.85 para FIB-4, 0.08 para HFS y −0.058 para NFS demostraron rendimientos diagnósticos con áreas bajo las curvas ROC de 0.79, 0.80, 0.70 y 0.68, respectivamente.
ConclusiónLos puntajes APRI, FIB-4, NFS y HFS son útiles para la evaluación de la fibrosis hepática en sujetos mexicanos con MASLD, siendo FIB-4 y APRI los de mejor rendimiento diagnóstico.
Nonalcoholic fatty liver disease (NAFLD) has historically been an entity whose naming leads to inaccuracies. These terminological imprecisions hinder adequate staging and accurate treatment of the disease, as well as the ability to establish precise prognoses. This problem was addressed in 2020 by Eslam et al., who headed an international consensus proposing the term “metabolic dysfunction-associated fatty liver disease” (MAFLD). This nomenclature more accurately reflects the current understanding of the pathophysiology of the disease, underlining the relation between hepatic steatosis and metabolic alterations, recognizing fatty liver as the hepatic component of the metabolic syndrome. It encompasses individuals with steatosis that meet certain metabolic criteria, regardless of whether they have high alcohol consumption or other underlying reasons for steatosis.1,2 However, a recent initiative proposes that the term MAFLD be modified to “metabolic dysfunction-associated steatotic liver disease” (MASLD), in an effort to lessen the stigma associated with the disease. This change of the term is based on 5 essential metabolic criteria: overweight/obesity, insulin resistance or type 2 diabetes, high blood pressure, hypertriglyceridemia, or irregularities in high-density lipoprotein (HDL) levels. The new nomenclature includes “metabolic and alcohol related/associated liver disease” (MetALD), which refers to individuals with MASLD that consume large quantities of alcohol (140 g per week for women and 210 g per week for men). Steatotic liver disease (SLD) is the term utilized to group together all the conditions that cause steatosis, and hepatic steatosis of unknown origin with no metabolic criteria is called cryptogenic SLD.3
Despite the concerns associated with the change in nomenclature, studies on different populations reveal that 95-99% of subjects with NAFLD meet the criteria for MASLD,4–6 suggesting that the natural history of the disease, the clinical profile, and the mortality rates are one and the same.7–9 In addition to the fact that the substitution of “fatty” with “steatotic” could contribute to reducing stigma, wide diffusion of the new terminology in scientific circles is indispensable. It is also essential to clearly explain the changes to patients, in order to promote greater awareness of the condition.5
The global prevalence of MASLD is troubling, as it is the main cause of liver disease worldwide.10,11 In Mexico, prevalence is estimated between 41 and 47%,12,13 making it essential to identify the risk factors and validate affordable tools for the early detection of liver fibrosis in those patients.
Liver fibrosis is a very important prognostic indicator in patients with MASLD due to its strong correlation with an increased risk for cardiovascular disease, cirrhosis of the liver, and hepatocellular carcinoma.14 Liver biopsy continues to be the gold standard but it has limitations that hinder its routine application, hence the urgent need to explore noninvasive biomarkers, especially in areas of Latin American with limited resources that could benefit more from such methods.15 In spite of the clinical importance of liver fibrosis, we still lack efficacious treatments, underlining the need for early detection and risk classification.
There are numerous scoring systems, such as the Fibrosis-4 (FIB-4) index, NAFLD score (NFS), Hepamet fibrosis score (HFS), and the aspartate aminotransferase (AST)-to-platelet ratio index (APRI), among others utilized for evaluating liver fibrosis.16–21 Nevertheless, their diagnostic efficacy in the Mexican population remains largely unexplored. Our aim in the present study was to evaluate and compare the diagnostic yield of the APRI, FIB-4, NFS, and HFS instruments for detecting liver fibrosis in Mexican individuals with MASLD.
Material and methodsStudy designA retrospective, analytic, observational study was conducted, utilizing nonrandomized sampling. To guarantee diagnostic accuracy, the STARD list was applied.
During 2020, a project for evaluating “fatty liver” was carried out in the Mexican city of Veracruz.12 The program involved 585 individuals from the general population. The participants had no known liver disease and did not have significant alcohol use, nor did they use drugs that could be associated with steatosis. The program consisted of a detailed clinical and biochemical evaluation. In addition, the FIB-4 index score was calculated for all the participants. The individuals with scores indicating a high or indeterminate risk for liver fibrosis were selected for a more in-depth evaluation through transient liver elastography (TLE), employing FibroScan® equipment.
Our study focused specifically on Mexican individuals, all of whom were above 18 years of age and residing in Veracruz, Mexico, and who completed the TLE study within the time frame of the program. In the selection process, only the medical records that were complete and contained a written statement of informed consent were chosen. Records with incomplete or missing information were not included (Fig. 1).

Importantly, two gastroenterologists and a clinical nutritionist carried out the TLE; they had the relevant certifications and solid experience in the elastography technique. A certified hepatologist was consulted regarding the interpretation of the results.
Body composition evaluationThe variables of weight (kg), height (cm), body mass index (BMI), amount of visceral fat (l) and fat mass (l) were obtained using SECA mBCA514 bioimpedance anthropometry equipment.22
Clinical and biochemical evaluationThe clinical and biochemical parameters were obtained from the medical records of the participants and included the pathologic personal history and different biochemical parameters, such as leukocytes, hemoglobin, hematocrit, creatinine, urea, uric acid, total bilirubin (TB), alkaline phosphatase (ALP), HDL, low-density lipoprotein (LDL), AST, alanine aminotransferase (ALT), triglycerides, total cholesterol, and the homeostatic model assessment for insulin resistance (HOMA-IR).23
Steatosis/liver fibrosis evaluationTLE was used as the reference method for the evaluation of liver fibrosis and steatosis. Liver stiffness was quantified and expressed in kilopascals (kPa). We established a cutoff point with the controlled attenuation parameter (CAP) with a median of ≥ 248 db/m for identifying the presence of steatosis.24 A cutoff point of ≥ 12.1 kPA was utilized to categorize liver fibrosis.21
MASLD diagnosisThe diagnosis of MASLD was based on international consensus criteria, considering individuals that showed liver steatosis through TLE. Diagnosis required the presence of at least one of the following metabolic criteria: BMI ≥ 25 kg/m² or a waist circumference ≥ 94 cm; fasting serum glucose ≥ 100 mg/dl or 2 h post-load glucose levels ≥ 140 mg/dl, or treatment for type 2 diabetes; blood pressure ≥ 130/85 mmHg or specific treatment for high blood pressure; plasma triglycerides ≥ 150 mg/dl or lipid lowering treatment; plasma HDL cholesterol ≤ 40 mg/dl in men and ≤ 50 mg/dl in women, or lipid lowering treatment.3
Liver fibrosis scoresThe APRI, FIB-4, HFS, and NFS were the four noninvasive scores employed. The following formulas were utilized to calculate the scores: APRI: (AST/LSN) x 100/platelets(109/l);17 FIB-4: age × AST (U/l)/platelets (109/l) x √ALT (U/l);21 NFS: −1.675 + 0.037 – age + 0.094 – BMI (kg/m2) + 1.13 × IR/diabetes (yes = 1, no = 0) + 0.99 × AST/ALT ratio – 0.013 × platelet count (×109/l) – 0.66 × albumin (g/dl);17 HFS: 1 / (1 + e (5.390 − 0.986 x age [45-64] – 1.719 x age [>65] + 0.875 x male sex – 0.896 x AST [35-69 IU/l] – 2.126 x AST [> 70 IU/l] – 0.027 x albumin [4-4.49 g/dl] – 0.897 x albumin [4 with no diabetes mellitus] – 2.184 x diabetes mellitus – 0.882 x platelets x 1.000/microl [155-219] – 2.233 x platelets x 1.000/microl [< 155]).25
Statistical analysisThe distribution of the data was evaluated through the Kolmogorov-Smirnov test and the Levene’s test of homoscedasticity. The numerical variables were expressed as mean ± standard deviation or median with interquartile range and compared using the corresponding Student’s t test or Wilcoxon test. The categorical variables were expressed as frequencies and percentages and compared using the chi-square test or the Fisher’s exact test. The correlations were made with the Pearson or Spearman correlation coefficients. Receiver operating characteristic (ROC) curves were utilized to determine the area under the curve (AUC) of each score, whereas sensitivity, specificity, positive predictive value (PPV), negative predictive value (NPV), and likelihood ratio (LR) were calculated using the Youden index. Statistical significance was set at a p < 0.05 and the data analysis was carried out using the R Studio version 4.2.0 and SPSS® version 25 programs.
Ethical considerationsAll study participants provided their written statements of informed consent, which were reviewed and approved by the Research and Ethics Committee of our institution (folio llMB-007-2020) before their incorporation. The study strictly followed the official data protection regulations and ethical principles established in the Declaration of Helsinki, at no monetary expense to the participants. All participants received the study results, with the option to receive free medical and/or nutritional counseling if they so desired. The data of the participants was handled with strict confidentiality and security measures, including de-identification, and access was restricted to authorized personnel. The participants had the right to withdraw from the study at any time, with no penalization.
ResultsPopulation characteristicsA total of 194 subjects were included in the study; 129 (66.5%) were women and 65 (33.5%) were men. Median patient age was 55 years (IQR 48-65). Based on the CAP, 150 (77.3%) of the participants were categorized as having MASLD, with a predominance of women and a median patient age of 55 years (IQR 47.7-64). Forty-four (22.7%) of the participants were classified as having no liver disease. Table 1 provides a detailed summary of the sociodemographic and epidemiologic characteristics of the participants.
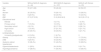
Sociodemographic and epidemiologic variables of the study population.
| Variable | Without MASLD diagnosis (n = 44) | With MASLD diagnosis (n = 127) | MASLD with fibrosis (n = 23) |
|---|---|---|---|
| Age | 55 (47.5-68) | 55 (46-64) | 62 (52-67) |
| Sex | |||
| Women | 35 (79.5%) | 75 (59.1%) | 13 (56.5%) |
| Men | 9 (20.5%) | 52 (40.9%) | 10 (43.5%) |
| BMI | 27.3 (27.3-30) | 31.6 (28.6-34.9) | 34.9 (30.-37.4) |
| Educational level | |||
| Illiterate | 0 | 4 (3.1%) | 1 (4.3%) |
| Primary school | 7 (15.9%) | 19 (15%) | 6 (26.1%) |
| Secondary school | 4 (9.1%) | 22 (17.3%) | 6 (26.1%) |
| High School | 7 (15.9%) | 27 (21.3%) | 5 (21.7%) |
| University (undergraduate) | 20 (45.5%) | 44 (34.6%) | 5 (21.7%) |
| University (postgraduate) | 6 (13.6%) | 11 (8.7%) | 0 |
| Obesity | 14 (31.8%) | 75 (59.1%) | 17 (73.9%) |
| DM2 | 9 (20.5%) | 43 (33.9%) | 13 (56.6%) |
| Systemic arterial hypertension | 16 (36.4%) | 51 (40.2%) | 16 (69.6%) |
| Hypercholesterolemia | 11 (25%) | 24 (18.9%) | 5 (21.7%) |
| Hypertriglyceridemia | 17 (38.6%) | 71 (55.9%) | 13 (56.5%) |
BMI: body mass index; DM2: type 2 diabetes mellitus; MASLD: metabolic dysfunction-associated steatotic liver disease.
Of the 150 subjects diagnosed with MASLD, 15.3% (n = 23) were classified with advanced liver fibrosis (kPa ≥ 12.1). Compared with the individuals with no fibrosis, those with liver fibrosis had significantly higher kPa (17.1 [14.2-25.5] vs 5.4 [4.4-6.3], p < 0.0001) and waist circumference (107.5 [98-118] vs 100.5 [90.5-109], p = 0.013). No statistically significant differences were observed regarding age (62 [52-67] vs 55 [46-64], p = 0.126), BMI (33.2 [30-37.7] vs 31.3 [27.9-34.4], p = 0.141), visceral fat (3.85 [2.95-5] vs 3.4 [2.6-4.5], p = 0.275), or CAP (323 [283-339] vs 307 [279-337], p = 0.652).
With respect to educational level, there were significant differences (p = 0.031) between the groups with and without fibrosis, with a lower educational level in the liver fibrosis group. There was also a higher prevalence of history of type 2 diabetes mellitus (56.5% vs 33.9%, p = 0.039) and high blood pressure (69.6% vs 33.9%, p = 0.009) in the fibrosis group. Table 1 provides detailed distributions of these and other sociodemographic characteristics.
Biochemical differences in subjects with MASLD and fibrosisIn the subjects diagnosed with MASLD, those with liver fibrosis had significant biochemical differences, compared with the subjects with no fibrosis. In the fibrosis group, elevated levels of fasting glucose (114 [91-182] vs 95 [89-103], p < 0.0001) and AST (49 [37-66] vs 32 [26-41], p = 0.0020) were observed. On the other hand, that group had lower LDL (97.1 ± 31 vs 115 ± 32.1, p = 0.015), total cholesterol (183.6 ± 41.4 vs 204 ± 36.2, p = 0.008), albumin (4 [3.5-4.2] vs 4.1 [3.9-4.2], p = 0.022), erythrocyte (4.37 [3.91-4.63] vs 4.5 [4.2-4.8], p = 0.001), hemoglobin (13.4 [12.6-14.4] vs 14 [13.3-15.1], p = 0.011), and platelet (188 [133-222] vs 213 [183-252], p = 0.002) levels, compared with the group with no liver fibrosis. Table 2 shows the comparisons of the rest of the biochemical variables.
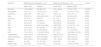
Comparison of the biochemical variables in subjects with MASLD.
| Variable | MASLD with no fibrosis n = 127 | MASLD with fibrosis n = 23 | p value | ||
|---|---|---|---|---|---|
| Mean (SD) | Median | Mean (SD) | Median (IQR) | ||
| Glucose | 104.5 (39.2) | 95 (89-103) | 140.4 (66.4) | 114 (91-182) | <0.0001 |
| Hemoglobin | 14 (1.6) | 14 (13.3-15.1) | 13 (2) | 13.4 (12.6-14.4) | 0.009 |
| Creatinine | 0.85 (.19) | 0.80 (.70-1) | 0.92 (0.41) | 0.80 (.70-1.1) | 0.378 |
| Urea | 35.5 (8.1) | 34.6 (29.9-40.2) | 37.9 (18.8) | 34.4 (25-45.3) | 0.658 |
| Uric acid | 5.9 (1.4) | 5.9 (5-7) | 6.1 (1.6) | 6.2 (4.8-7.2) | 0.231 |
| AST | 37.4 (17.8) | 32 (26-41) | 53.7 (24.6) | 49 (37-66) | 0.002 |
| ALT | 43.2 (34.1) | 31 (24-49) | 49.2 (27.4) | 38 (32-60) | 0.124 |
| TB | 0.68 (0.28) | 0.60 (0.50-0.80) | 0.89 (0.58) | 0.70 (0.50-.1.10) | 0.100 |
| ALP | 91.9 (77.6) | 81 (67-98) | 109.1 (59.9) | 89 (73-127) | 0.204 |
| HDL | 54.1 (15.5) | 54 (43.7-62.4) | 52.6 (16.5) | 51.6 (44-59.6) | 0.420 |
| LDL | 115.1 (32.1) | 114 (94.7-136.3) | 97.1 (31) | 104.5 (68.3-115.5) | 0.016 |
| Triglycerides | 184.7 (83.3) | 155 (128-221) | 169.22 (75.1) | 144 (104-218) | 0.873 |
| Total cholesterol | 206 (36.2) | 204 (178-230) | 183.6 (41.4) | 186 (149-214) | 0.014 |
| Platelets | 222.1 (60.1) | 213 (183-252) | 179.1 (64.2) | 188 (133-222) | 0.001 |
| Albumin | 4 (0.25) | 4.1 (3.9-4.2) | 3.8 (0.39) | 4 (3.5-4.2) | 0.022 |
| Erythrocytes | 4.5 (0.44) | 4.5 (4.2-4.8) | 4.2 (0.49) | 4.37 (3.91-4.63) | 0.001 |
The measurements are presented as mean with standard deviation and median with interquartile range. The comparison between groups was carried out using the corresponding Student’s t test or Wilcoxon test.
ALP: alkaline phosphatase; ALT: alanine aminotransferase; AST: aspartate aminotransferase; HDL: high density lipoprotein; IQR: interquartile range; LDL: low density lipoprotein; MASLD: metabolic dysfunction-associated steatotic liver disease; SD: standard deviation; TB: total bilirubin.
The individuals diagnosed with MASLD and liver fibrosis showed significant increases in the scores calculated with the APRI (0.74 [0.51-1.2] vs 0.45 [0.34-0.62], p = 0.004), FIB-4 (2.37 [1.74-3.47] vs 1.57 [1.08-1.96], p = 0.007), and HFS (0.15 [0.06-0.58] vs 0.04 [0.01-0.10], p = 0.009), compared with the subjects with no fibrosis. Even though the score calculated with the NFS was higher in the individuals with MASLD and fibrosis (0.12 [-1.18-1.10] vs (-0.96 [-1.91- -0.12]), the difference was not statistically significant (p = 0.628).
Correlations between scoresThe correlations between the kPa values and the scores calculated with the APRI, FIB-4, HFS, and NFS were (r = .445, p = 0.0001), (r = .230, p = 0.005), (r = .247, p = 0.002), and (r = .208, p = 0.011), respectively. In addition, all the scores had a moderate-to-strong correlation with each other.
Diagnostic yield of the noninvasive scores for liver fibrosisFig. 2 shows the ROC curves for the APRI, FIB-4, HFS, and NFS scores, describing the values of the AUC of 0.79, 0.80, 0.70, and 0.68, respectively. The cutoff points equivalent to ≥ 12.1 kPa in the elastography test for each of the following were: APRI: 0.56, FIB-4: 1.82, HFS: 0.08, and NFS: -0.54. Table 3 includes a summary of the cutoff points, sensitivity, specificity, PPV, NPV, and LR for each score.
 curves were constructed to evaluate the diagnostic yield of different noninvasive scores for liver fibrosis in subjects with metabolic dysfunction-associated steatotic liver disease (MASLD). Liver fibrosis was evaluated through transient liver elastography, with a threshold ≥ 12.1 kPa indicating the presence of fibrosis.")
Diagnostic yield of FIB-4, APRI, HFS, and NFS for evaluating liver fibrosis in MASLD. Receiver operating characteristic (ROC) curves were constructed to evaluate the diagnostic yield of different noninvasive scores for liver fibrosis in subjects with metabolic dysfunction-associated steatotic liver disease (MASLD). Liver fibrosis was evaluated through transient liver elastography, with a threshold ≥ 12.1 kPa indicating the presence of fibrosis.
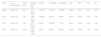
Diagnostic yield of the different noninvasive scores for evaluating liver fibrosis in Mexican subjects with MASLD.
| Score | Liver elastography | Cutoff point | AUROC (95% CI) | p value | Sensitivity | Specificity | PPV | NPV | LR+ | LR- |
|---|---|---|---|---|---|---|---|---|---|---|
| APRI | kPa ≥ 12.1 | 0.57 | 0.79 (0.69-0.88) | <0.0001 | 73.91% | 70.08% | 30.8% | 93.7% | 2.47 | 0.37 |
| FIB-4 | kPa ≥ 12.1 | 1.85 | 0.80 (0.70-0.89) | <0.0001 | 69.5% | 68.5% | 28.5% | 92.5% | 2.21 | 0.44 |
| HFS | kPa ≥ 12.1 | 0.08 | 0.70 (0.57-0.83) | 0.002 | 65.22% | 71.4% | 29.1% | 91.9% | 2.28 | 0.49 |
| NFS | kPa ≥ 12.1 | -0.58 | 0.68 (0.55-0.81) | 0.007 | 60.8% | 62.4% | 22.6% | 89.8% | 1.62 | 0.63 |
The cutoff point ≥ 12.1 kilopascals was examined.
APRI: aspartate aminotransferase-to-platelet ratio index; AUROC: area under the ROC curve; FIB-4: fibrosis-4 index; HFS: Hepamet fibrosis score; kPa: kilopascal; NFS: NAFLD fibrosis score; LR: likelihood ratio; MASLD: metabolic dysfunction-associated steatotic liver disease; NPV: negative predictive value; PPV: positive predictive value.
Liver fibrosis is a frequent complication of MASLD and demands a detailed evaluation for optimum clinical management. Our study focused on determining and comparing the diagnostic yield of four noninvasive biomarkers (APRI, FIB-4, HFS, and NFS) for assessing advanced liver fibrosis in Mexican subjects with MASLD. Our results showed that all the scores analyzed had a satisfactory diagnostic yield, but the APRI and FIB-4 were superior to the HFS and NFS. Our findings suggest that a FIB-4 value above 1.85 and an APRI value above 0.57 could be efficacious tools for the noninvasive evaluation of liver fibrosis in individuals with MASLD. This can contribute to more accurate decision-making and more effective monitoring of disease progression, especially in geographic areas with limited resources.
According to our liver elastography results, 15.3% of the participants with MASLD showed signs of liver fibrosis (> 12.1 kPa), concurring with the results of previous studies.26 Nevertheless, the elevated presence of MASLD (77.3%) in our sample should be interpreted with caution, given the specific selection of patients for TLE, targeted at those with steatosis and a higher risk for fibrosis, as described in the complete report of the program.12 Even though the prevalence of MASLD can appear to be high, most likely the prevalence of liver fibrosis is estimated accurately.
Our results suggest that the noninvasive scoring systems could be useful biomarkers in the early detection of liver fibrosis in Mexican patients with MASLD, but conducting more studies in different zones of Mexico is imperative for corroborating the diagnostic validity of those tools.
Similar evaluations have been carried out in different populations. For example, Amernia et al. compared the FIB-4, APRI, and AST/ALT ratio index, utilizing TLE, and found that the APRI and FIB-4 had greater diagnostic yield.27 This result coincides with our findings and with those of Alqahtani et al., highlighting the diagnostic efficacy of the FIB-4 and APRI, compared with other noninvasive instruments.28 However, other authors have reported a superiority of FIB-4 and NFS over APRI, with respect to predicting liver events and mortality in patients with MASLD.20
The limitations of our study must be taken into account. Even though the study provides valuable information, the generalization of the results can be limited due to its observational and retrospective design, the use of nonrandomized sampling, and the geographic concentration in Veracruz, Mexico. The representativity of the sample is another crucial area of consideration, given that the selection of individuals was based on specific FIB-4 score criteria, which could overestimate the diagnostic yield and not capture the full heterogeneity of the population with MASLD. In addition, interoperator variability in the professionals that performed the TLE was not measured or reported, even though all those involved were certified and have broad experience in performing elastography. Notably, a high percentage of the sample, specifically 91.3%, presented with overweight or obesity, which could influence the interpretation and applicability of the results. By recognizing and addressing the limitations of our study, not only does it provide an adequate contextual framework for its findings, but also paves the way for new research, driving continued improvement in the understanding and management of liver fibrosis in individuals with MASLD. To meet these challenges, we recommend that future studies adopt a longitudinal design and incorporate more accurate diagnostic tools, such as liver biopsy. Considering alternative scoring systems that combine a broader range of clinical, biochemical, and genetic biomarkers could significantly enrich the diagnosis and treatment of this condition. These strategies, taken together, hold the promise of contributing substantially to the evolution of knowledge and clinical practice in the field of liver fibrosis associated with MASLD.
ConclusionsIn conclusion, the present study shows that the APRI, FIB-4, NAFLD score, and Hepamet Fibrosis Score are useful instruments for evaluating liver fibrosis in Mexican subjects with MASLD. Of those four systems, the FIB-4 and APRI had the best diagnostic yield.
Financial disclosureThis study received financial support through the CONAHCYT CVU1138232 and Proyecto de Ciencia Básica#256235 grants.
Conflict of interestThe authors declare that there is no conflict of interest.

