


Irritable bowel syndrome (IBS) is a multifactorial condition, in which diet is a main trigger of symptoms. Many patients modify their diet without professional supervision, which can cause nutritional risks or aggravate symptoms. The aim of this study was to evaluate the dietary intake of patients with IBS versus healthy subjects.
Material and methodsAn observational, analytic, cross-sectional study was conducted on 108 subjects: 77 (71.3%) diagnosed with IBS (Rome IV criteria) and 31 (28.7%) healthy controls. Patient age was from 18 to 66 years and the woman-to-man ratio was 4.1:1. Both groups completed a 7-day food diary, registering their usual diet that was then analyzed using a nutrition software program.
ResultsMacronutrient intake was similar between the two groups but the patients with IBS had a significantly higher intake of vitamins D (p ≤ 0.001), B1 (p ≤ 0.001), B2 (p ≤ 0.001), and B3 (p ≤ 0.001). There was greater vitamin B3 intake in patients with an IBS subtype (p = 0.005). There were no significant differences in fiber consumption.
ConclusionThe diet of Mexican patients with IBS was slightly different from that of healthy subjects. The IBS patients consumed more fiber and their FODMAP intake was similar to that of the healthy controls. Even though the majority of the IBS patients met the recommendations for macronutrient and micronutrient intake, nutritional guidance in the management of IBS is recommended because dietary adjustments can significantly improve symptoms.
El síndrome de intestino irritable (SII) es una condición multifactorial, donde la dieta es un desencadenante principal de los síntomas. Muchos pacientes modifican su alimentación sin supervisión profesional, lo que puede ocasionar riesgos nutricionales o agravar los síntomas. El objetivo de este estudio fue evaluar la ingesta dietética de pacientes con SII comparado con sujetos sanos.
Material y métodosEstudio transversal, analítico y observacional con 108 sujetos: 77 (71.3%) con diagnóstico de SII (criterios Roma IV) y 31 (28.7%) controles sanos, con edades entre 18 y 66 años y una proporción de 4.1:1 entre mujeres y hombres. Ambos grupos completaron un diario alimentario de 7 días, registrando su dieta habitual, analizada mediante un programa de nutrición.
ResultadosLa ingesta de macronutrientes fue similar entre los grupos. Sin embargo, los pacientes con SII mostraron un consumo significativamente mayor de vitaminas D (p ≤ 0.001), B1 (p ≤ 0.001), B2 (p ≤ 0.001) y B3 (p ≤ 0.001). Entre los subtipos de SII, se observó un mayor consumo de vitamina B3 (p = 0.005). No hubo diferencias significativas en el consumo de fibra.
ConclusiónLa dieta de los pacientes mexicanos con SII presenta leves diferencias respecto a los sujetos sanos. Los pacientes con SII consumen más fibra y tienen una ingesta de FODMAPs similar a los controles sanos. Aunque la mayoría de estos pacientes cumple con la ingesta recomendada de macro y micronutrientes, se recomienda orientación nutricional en el manejo del SII, ya que los ajustes dietéticos pueden mejorar significativamente los síntomas.
Irritable bowel syndrome (IBS) belongs to the group of conditions known as disorders of gut-brain interaction, previously called functional gastrointestinal disorders.1 In Mexico, the prevalence of IBS varies from 16 to 35% and the worldwide prevalence is 11%. It predominates in females and greatly affects patient quality of life.2–4 IBS is characterized by the presence of pain or intestinal discomfort associated with changes in bowel habits, in the absence of an organic lesion causing the symptoms.5
IBS pathophysiology is complex and multifactorial. Gut microbiota alterations, psychologic comorbidity (anxiety, depression), visceral hypersensitivity, bile acid malabsorption, increased intestinal permeability, and dietary factors are among the main factors described.6 The role of diet has garnered special interest in recent years, regarding the pathogenesis of IBS.7 Up to two-thirds of subjects with IBS are reported to perceive that their symptoms are related to a dietary component, and so they restrict or eliminate certain foods from their diet that they consider triggers, without the evaluation of a nutritional expert.8 Milk and its derivatives, wheat, caffeine, meats, cabbage, onions, legumes, chili peppers, fried foods, and smoked products are among the foods most commonly identified as culprits, which when restricted, could condition the risk of imbalanced nutrition.8,9
There are numerous intervention studies on patients with IBS that eliminate the foods most commonly identified as triggers (FODMAPs), but few studies describe the characteristics of the usual diet of said patients. Therefore, the aim of our study was to evaluate the dietary composition in Mexican IBS patients and compare it with that of healthy subjects.
MethodsAn observational, analytic, cross-sectional study was conducted at the Instituto de Investigaciones Médico-Biológicas of the Universidad Veracruzana within the time frame of January to June 2022.
SubjectsPatients referred to our center that were above 18 years of age and diagnosed with IBS, based on the Rome IV criteria,10 were included in the study. A group of subjects considered asymptomatic, in the absence of Rome IV criteria, and that presented with no previous diseases were the healthy controls. They were selected from an open population as voluntary participants, giving their authorized informed consent. Subjects with serious diseases that could affect nutrient intake were excluded from the study and subjects that did not complete the 7-day food diary were eliminated from it (Fig. 1).
Food diary
Both groups received a diary designed to register food consumption for a period of 7 days. The subjects were told to maintain their usual diet and record all foods and drinks consumed daily, describing the quantities as accurately as possible. Special emphasis was placed on writing a detailed description of the ingredients in each food that was recorded. To make a uniform quantity calculation easier, a guide on food portion sizes with photographs was provided.
After completing the 7-day food diary, the information was entered into the Nutrimind® software program, which is specially designed to provide a detailed analysis of dietary intake, based on the Mexican System of Food Equivalents,11 registering the type of food, ingredients, and beverages consumed. From those data, Nutrimind® calculates the daily intake of macronutrients, micronutrients, and calories for each individual. The weekly average of dietary intake is then calculated for each patient. Importantly, the data obtained were corroborated by a nutrition specialist. In addition, FODMAP intake was evaluated utilizing the Monash University traffic light system,12 which categorizes foods in relation to their high or low FODMAP content.
Statistical analysisData distribution was assessed through the Kolmogorov-Smirnov test and homoscedasticity through the Levene’s test. The numerical variables were expressed as mean and standard deviation or interquartile range and compared using the Student’s t test or the Mann-Whitney U test, as appropriate. The categorical variables were presented as frequencies and percentages and compared using the chi-square test or the Fisher’s exact test. Comparisons between the two groups were made through the ANOVA test or Kruskal-Wallis test, as appropriate. Statistical significance was set at a p value < 0.05. The analysis of the results was carried out using the SPSS® version 26 program.
Ethical considerationsThis study was conducted according to the Declaration of Helsinki and was approved by the local research committee of the Instituto de Investigaciones Médico-Biológicas. All the subjects authorized their participation through informed consent.
ResultsA total of 108 subjects were included in the study. The mean age of the participants was 26 years, with a range of 18-66 years. Seventy-seven (71.3%) of the participants met the Rome IV criteria10 for the diagnosis of IBS, with a median age of 26 years (24-46.5) and a predominance of females (85.7%). Thirty-one (28.7%) of the subjects were classified as healthy, their mean age was 25 years (20-31.25), and 67.3% were females. The patients with IBS had greater overweight, with a BMI of 26.07 (± 4.5), compared with the 23.6 (± 3.0) for the healthy controls (p = 0.007) (Table 1).
Sociodemographic variables of the population studied.
| Healthy controls | IBS patients | p value | |
|---|---|---|---|
| n (%) | 31 (28.7%) | 77 (71.3%) | |
| Ageb | 25 (20-31.25) | 26 (24-46.5) | 0.001 |
| Sex F/M | 21 (67.7%) / 10 (32.3%) | 66 (85.7%) / 11 (14.3%) | 0.033 |
| BMIa | 23.61 ± 3.0 | 26.07 ± 4.52 | 0.002 |
BMI: body mass index; F: female; IBS: irritable bowel syndrome; IQR: interquartile range; M: male; SD: standard deviation.
The subtype distribution was diarrhea-predominant IBS (IBS-D) in 21 (19.4%) patients, constipation-predominant IBS (IBS-C) in 33 (30.6%), and mixed-type IBS (IBS-M) in 23 (21.3%).
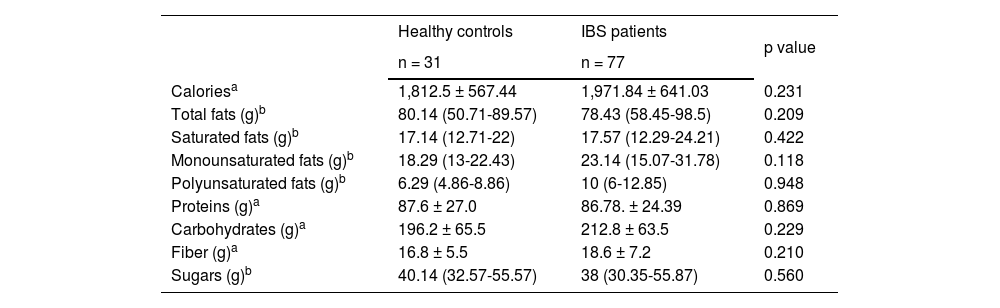
Calories, fats, and macronutrientsIBS patients had a higher caloric intake, with a mean 1,971.84 ± 641.03 kcal, compared with the healthy subjects, who registered a mean 1,812.5 ± 567.44 kcal, and total fat intake was lower in the IBS patients. The differences were not statistically significant.
With respect to macronutrients, there were no statistically significant differences between the two groups. The patients with IBS had a slightly lower fiber intake, with a mean 18.6 ± 7.2 g, compared with the healthy subjects, who had a mean 16.8 ± 5.5 g, but that difference was not statistically significant (Table 2).
Calorie, fat, and macronutrient intake of healthy controls and IBS patients.
| Healthy controls | IBS patients | p value | |
|---|---|---|---|
| n = 31 | n = 77 | ||
| Caloriesa | 1,812.5 ± 567.44 | 1,971.84 ± 641.03 | 0.231 |
| Total fats (g)b | 80.14 (50.71-89.57) | 78.43 (58.45-98.5) | 0.209 |
| Saturated fats (g)b | 17.14 (12.71-22) | 17.57 (12.29-24.21) | 0.422 |
| Monounsaturated fats (g)b | 18.29 (13-22.43) | 23.14 (15.07-31.78) | 0.118 |
| Polyunsaturated fats (g)b | 6.29 (4.86-8.86) | 10 (6-12.85) | 0.948 |
| Proteins (g)a | 87.6 ± 27.0 | 86.78. ± 24.39 | 0.869 |
| Carbohydrates (g)a | 196.2 ± 65.5 | 212.8 ± 63.5 | 0.229 |
| Fiber (g)a | 16.8 ± 5.5 | 18.6 ± 7.2 | 0.210 |
| Sugars (g)b | 40.14 (32.57-55.57) | 38 (30.35-55.87) | 0.560 |
g: grams; IBS: irritable bowel syndrome; IQR: interquartile range; SD: standard deviation.
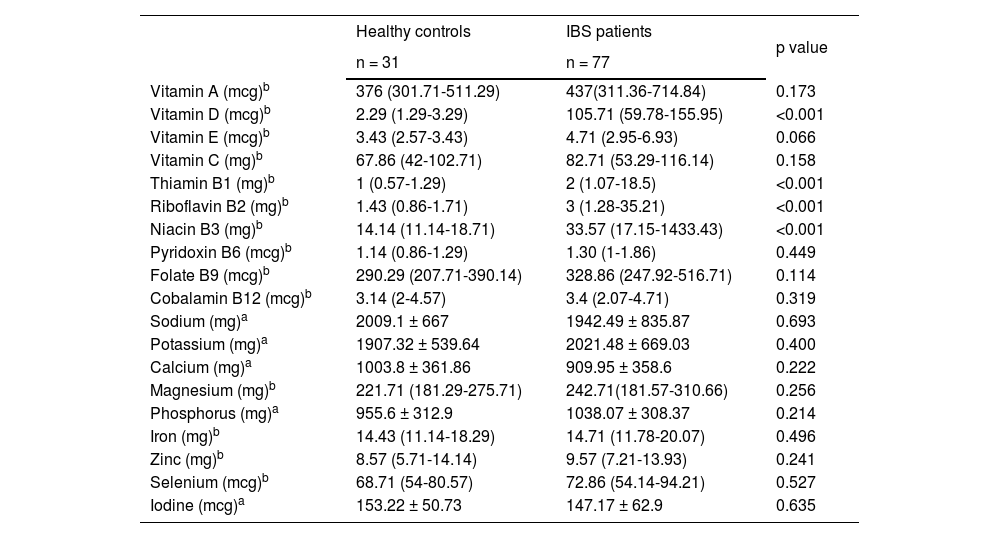
The IBS patients had a significantly higher intake of vitamin D (105.71 [59.78-155.95] vs 2.29 [1.29-3.29], p ≤ 0.001); thiamin B1 (2 [1.07-18.5] vs 1 [0.57-1.29], p ≤ 0.001); riboflavin B2 (3 [1.28-35.21] vs 1.43 [0.86-1.71], p ≤ 0.001); and niacin B3 (33.57 [17.15-1433.43] vs 14.14 [11.14-18.71], p ≤ 0.001), compared with the healthy subjects. Mineral intake was not statistically significant, with similar values in the two groups (Table 3).
Vitamin and mineral intake of healthy controls and IBS patients.
| Healthy controls | IBS patients | p value | |
|---|---|---|---|
| n = 31 | n = 77 | ||
| Vitamin A (mcg)b | 376 (301.71-511.29) | 437(311.36-714.84) | 0.173 |
| Vitamin D (mcg)b | 2.29 (1.29-3.29) | 105.71 (59.78-155.95) | <0.001 |
| Vitamin E (mcg)b | 3.43 (2.57-3.43) | 4.71 (2.95-6.93) | 0.066 |
| Vitamin C (mg)b | 67.86 (42-102.71) | 82.71 (53.29-116.14) | 0.158 |
| Thiamin B1 (mg)b | 1 (0.57-1.29) | 2 (1.07-18.5) | <0.001 |
| Riboflavin B2 (mg)b | 1.43 (0.86-1.71) | 3 (1.28-35.21) | <0.001 |
| Niacin B3 (mg)b | 14.14 (11.14-18.71) | 33.57 (17.15-1433.43) | <0.001 |
| Pyridoxin B6 (mcg)b | 1.14 (0.86-1.29) | 1.30 (1-1.86) | 0.449 |
| Folate B9 (mcg)b | 290.29 (207.71-390.14) | 328.86 (247.92-516.71) | 0.114 |
| Cobalamin B12 (mcg)b | 3.14 (2-4.57) | 3.4 (2.07-4.71) | 0.319 |
| Sodium (mg)a | 2009.1 ± 667 | 1942.49 ± 835.87 | 0.693 |
| Potassium (mg)a | 1907.32 ± 539.64 | 2021.48 ± 669.03 | 0.400 |
| Calcium (mg)a | 1003.8 ± 361.86 | 909.95 ± 358.6 | 0.222 |
| Magnesium (mg)b | 221.71 (181.29-275.71) | 242.71(181.57-310.66) | 0.256 |
| Phosphorus (mg)a | 955.6 ± 312.9 | 1038.07 ± 308.37 | 0.214 |
| Iron (mg)b | 14.43 (11.14-18.29) | 14.71 (11.78-20.07) | 0.496 |
| Zinc (mg)b | 8.57 (5.71-14.14) | 9.57 (7.21-13.93) | 0.241 |
| Selenium (mcg)b | 68.71 (54-80.57) | 72.86 (54.14-94.21) | 0.527 |
| Iodine (mcg)a | 153.22 ± 50.73 | 147.17 ± 62.9 | 0.635 |
IBS: irritable bowel syndrome; IQR: interquartile range; mcg: micrograms; mg: milligrams; SD: standard deviation.
Upon determining energy (calories) and the macronutrients, adjusted according to the calculated ideal weight of each subject, and analyzing the micronutrient intake, considering the daily recommended levels for the Mexican population that vary according to age and sex,13,14 more than half of the subjects with IBS did not meet the intake recommendations. This was particularly noticeable in fiber consumption, as well as in minerals, such as zinc, magnesium, iron, potassium, and calcium, and in vitamins A, E, B9, and D (Fig. 2).

Percentage per subject group that met and did not meet the recommended calorie, macronutrient, and micronutrient intake. Recommended macronutrient intake was determined according to ideal weight of each subject and micronutrient intake by age and sex.
IBS: irritable bowel syndrome.
Source: Nutrient intake recommendations for the Mexican population.12,13
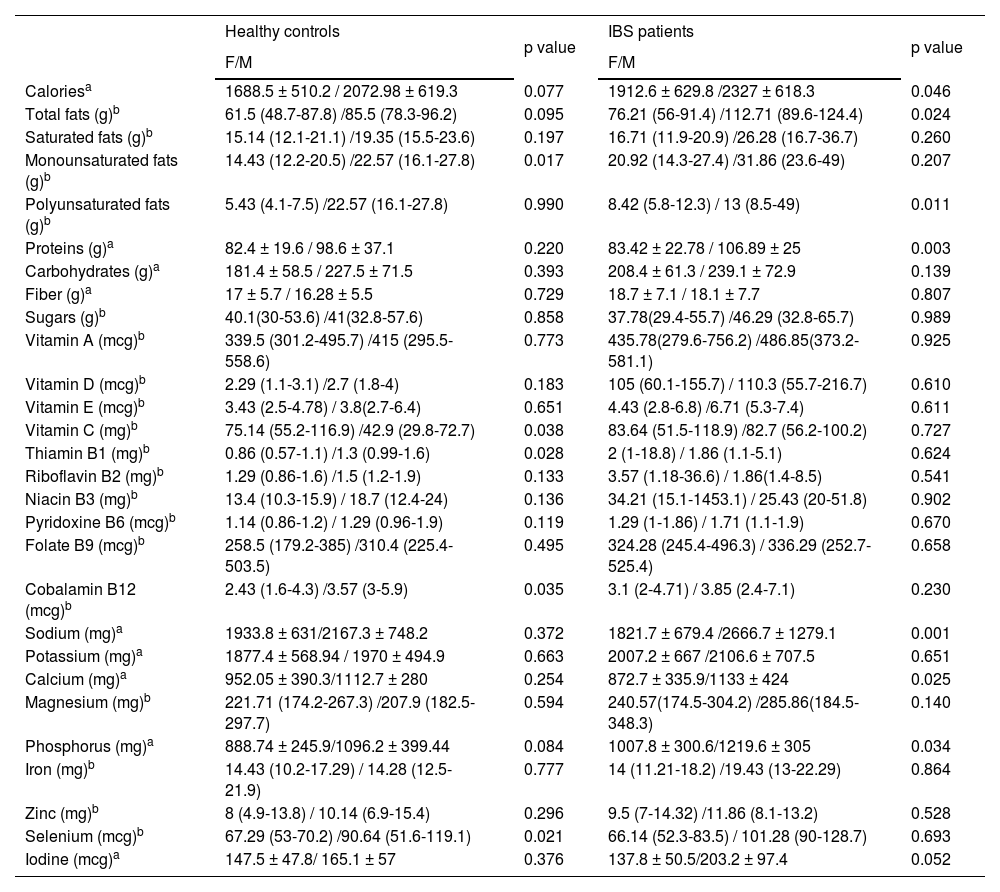
In the sub-analysis by sex, males had a higher caloric intake than females. Males in the IBS group had a significantly higher caloric intake (p = 0.046) and a higher intake of total fats (p = 0.024), polyunsaturated fats (p = 0.011), proteins (p = 0.003), sodium (p = 0.001), calcium (p = 0.025), and phosphorus (p = 0.034). In contrast, the male healthy controls had a significantly higher intake of monounsaturated fats (p = 0.017), thiamin (p = 0.028), cobalamin (p = 0.035), and selenium (p = 0.021). Vitamin C was the exception, as its intake was higher in females (p = 0.038) (Table 4).
Intake of healthy controls and IBS patients by sex.
| Healthy controls | p value | IBS patients | p value | |
|---|---|---|---|---|
| F/M | F/M | |||
| Caloriesa | 1688.5 ± 510.2 / 2072.98 ± 619.3 | 0.077 | 1912.6 ± 629.8 /2327 ± 618.3 | 0.046 |
| Total fats (g)b | 61.5 (48.7-87.8) /85.5 (78.3-96.2) | 0.095 | 76.21 (56-91.4) /112.71 (89.6-124.4) | 0.024 |
| Saturated fats (g)b | 15.14 (12.1-21.1) /19.35 (15.5-23.6) | 0.197 | 16.71 (11.9-20.9) /26.28 (16.7-36.7) | 0.260 |
| Monounsaturated fats (g)b | 14.43 (12.2-20.5) /22.57 (16.1-27.8) | 0.017 | 20.92 (14.3-27.4) /31.86 (23.6-49) | 0.207 |
| Polyunsaturated fats (g)b | 5.43 (4.1-7.5) /22.57 (16.1-27.8) | 0.990 | 8.42 (5.8-12.3) / 13 (8.5-49) | 0.011 |
| Proteins (g)a | 82.4 ± 19.6 / 98.6 ± 37.1 | 0.220 | 83.42 ± 22.78 / 106.89 ± 25 | 0.003 |
| Carbohydrates (g)a | 181.4 ± 58.5 / 227.5 ± 71.5 | 0.393 | 208.4 ± 61.3 / 239.1 ± 72.9 | 0.139 |
| Fiber (g)a | 17 ± 5.7 / 16.28 ± 5.5 | 0.729 | 18.7 ± 7.1 / 18.1 ± 7.7 | 0.807 |
| Sugars (g)b | 40.1(30-53.6) /41(32.8-57.6) | 0.858 | 37.78(29.4-55.7) /46.29 (32.8-65.7) | 0.989 |
| Vitamin A (mcg)b | 339.5 (301.2-495.7) /415 (295.5-558.6) | 0.773 | 435.78(279.6-756.2) /486.85(373.2-581.1) | 0.925 |
| Vitamin D (mcg)b | 2.29 (1.1-3.1) /2.7 (1.8-4) | 0.183 | 105 (60.1-155.7) / 110.3 (55.7-216.7) | 0.610 |
| Vitamin E (mcg)b | 3.43 (2.5-4.78) / 3.8(2.7-6.4) | 0.651 | 4.43 (2.8-6.8) /6.71 (5.3-7.4) | 0.611 |
| Vitamin C (mg)b | 75.14 (55.2-116.9) /42.9 (29.8-72.7) | 0.038 | 83.64 (51.5-118.9) /82.7 (56.2-100.2) | 0.727 |
| Thiamin B1 (mg)b | 0.86 (0.57-1.1) /1.3 (0.99-1.6) | 0.028 | 2 (1-18.8) / 1.86 (1.1-5.1) | 0.624 |
| Riboflavin B2 (mg)b | 1.29 (0.86-1.6) /1.5 (1.2-1.9) | 0.133 | 3.57 (1.18-36.6) / 1.86(1.4-8.5) | 0.541 |
| Niacin B3 (mg)b | 13.4 (10.3-15.9) / 18.7 (12.4-24) | 0.136 | 34.21 (15.1-1453.1) / 25.43 (20-51.8) | 0.902 |
| Pyridoxine B6 (mcg)b | 1.14 (0.86-1.2) / 1.29 (0.96-1.9) | 0.119 | 1.29 (1-1.86) / 1.71 (1.1-1.9) | 0.670 |
| Folate B9 (mcg)b | 258.5 (179.2-385) /310.4 (225.4-503.5) | 0.495 | 324.28 (245.4-496.3) / 336.29 (252.7-525.4) | 0.658 |
| Cobalamin B12 (mcg)b | 2.43 (1.6-4.3) /3.57 (3-5.9) | 0.035 | 3.1 (2-4.71) / 3.85 (2.4-7.1) | 0.230 |
| Sodium (mg)a | 1933.8 ± 631/2167.3 ± 748.2 | 0.372 | 1821.7 ± 679.4 /2666.7 ± 1279.1 | 0.001 |
| Potassium (mg)a | 1877.4 ± 568.94 / 1970 ± 494.9 | 0.663 | 2007.2 ± 667 /2106.6 ± 707.5 | 0.651 |
| Calcium (mg)a | 952.05 ± 390.3/1112.7 ± 280 | 0.254 | 872.7 ± 335.9/1133 ± 424 | 0.025 |
| Magnesium (mg)b | 221.71 (174.2-267.3) /207.9 (182.5-297.7) | 0.594 | 240.57(174.5-304.2) /285.86(184.5-348.3) | 0.140 |
| Phosphorus (mg)a | 888.74 ± 245.9/1096.2 ± 399.44 | 0.084 | 1007.8 ± 300.6/1219.6 ± 305 | 0.034 |
| Iron (mg)b | 14.43 (10.2-17.29) / 14.28 (12.5-21.9) | 0.777 | 14 (11.21-18.2) /19.43 (13-22.29) | 0.864 |
| Zinc (mg)b | 8 (4.9-13.8) / 10.14 (6.9-15.4) | 0.296 | 9.5 (7-14.32) /11.86 (8.1-13.2) | 0.528 |
| Selenium (mcg)b | 67.29 (53-70.2) /90.64 (51.6-119.1) | 0.021 | 66.14 (52.3-83.5) / 101.28 (90-128.7) | 0.693 |
| Iodine (mcg)a | 147.5 ± 47.8/ 165.1 ± 57 | 0.376 | 137.8 ± 50.5/203.2 ± 97.4 | 0.052 |
F: female; g: grams; IBS: irritable bowel syndrome; IQR: interquartile range; M: male; mcg: micrograms; mg: milligrams; SD: standard deviation.
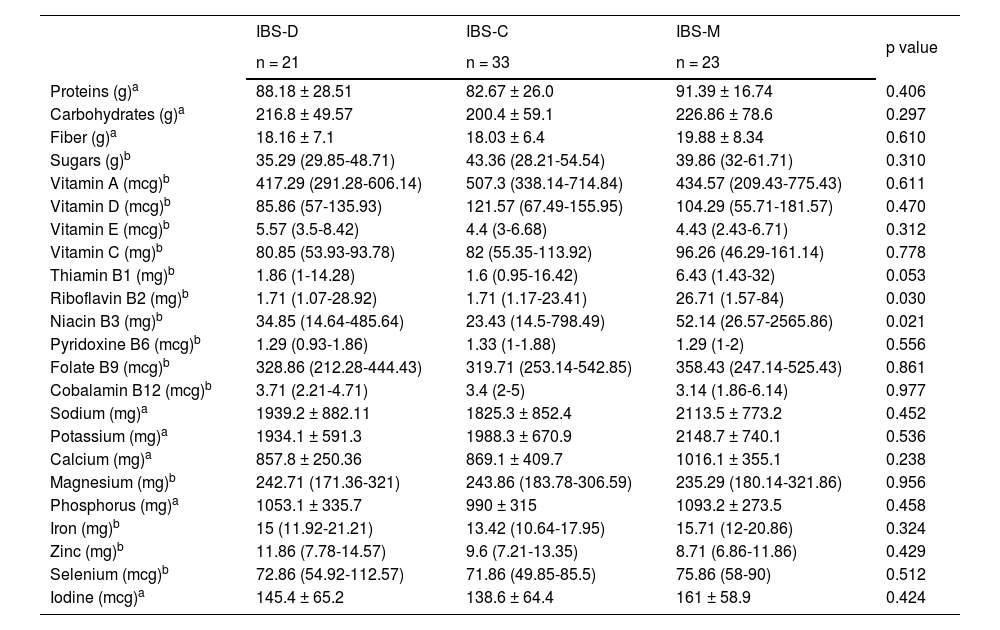
The analysis of macronutrient and micronutrient by IBS subtype showed no significant differences, except for vitamin B2 (p = 0.030) and vitamin B3 (p = 0.021), which were significantly higher in the patients with IBS-M (Table 5).
Macronutrient and micronutrient intake by IBS subtype.
| IBS-D | IBS-C | IBS-M | p value | |
|---|---|---|---|---|
| n = 21 | n = 33 | n = 23 | ||
| Proteins (g)a | 88.18 ± 28.51 | 82.67 ± 26.0 | 91.39 ± 16.74 | 0.406 |
| Carbohydrates (g)a | 216.8 ± 49.57 | 200.4 ± 59.1 | 226.86 ± 78.6 | 0.297 |
| Fiber (g)a | 18.16 ± 7.1 | 18.03 ± 6.4 | 19.88 ± 8.34 | 0.610 |
| Sugars (g)b | 35.29 (29.85-48.71) | 43.36 (28.21-54.54) | 39.86 (32-61.71) | 0.310 |
| Vitamin A (mcg)b | 417.29 (291.28-606.14) | 507.3 (338.14-714.84) | 434.57 (209.43-775.43) | 0.611 |
| Vitamin D (mcg)b | 85.86 (57-135.93) | 121.57 (67.49-155.95) | 104.29 (55.71-181.57) | 0.470 |
| Vitamin E (mcg)b | 5.57 (3.5-8.42) | 4.4 (3-6.68) | 4.43 (2.43-6.71) | 0.312 |
| Vitamin C (mg)b | 80.85 (53.93-93.78) | 82 (55.35-113.92) | 96.26 (46.29-161.14) | 0.778 |
| Thiamin B1 (mg)b | 1.86 (1-14.28) | 1.6 (0.95-16.42) | 6.43 (1.43-32) | 0.053 |
| Riboflavin B2 (mg)b | 1.71 (1.07-28.92) | 1.71 (1.17-23.41) | 26.71 (1.57-84) | 0.030 |
| Niacin B3 (mg)b | 34.85 (14.64-485.64) | 23.43 (14.5-798.49) | 52.14 (26.57-2565.86) | 0.021 |
| Pyridoxine B6 (mcg)b | 1.29 (0.93-1.86) | 1.33 (1-1.88) | 1.29 (1-2) | 0.556 |
| Folate B9 (mcg)b | 328.86 (212.28-444.43) | 319.71 (253.14-542.85) | 358.43 (247.14-525.43) | 0.861 |
| Cobalamin B12 (mcg)b | 3.71 (2.21-4.71) | 3.4 (2-5) | 3.14 (1.86-6.14) | 0.977 |
| Sodium (mg)a | 1939.2 ± 882.11 | 1825.3 ± 852.4 | 2113.5 ± 773.2 | 0.452 |
| Potassium (mg)a | 1934.1 ± 591.3 | 1988.3 ± 670.9 | 2148.7 ± 740.1 | 0.536 |
| Calcium (mg)a | 857.8 ± 250.36 | 869.1 ± 409.7 | 1016.1 ± 355.1 | 0.238 |
| Magnesium (mg)b | 242.71 (171.36-321) | 243.86 (183.78-306.59) | 235.29 (180.14-321.86) | 0.956 |
| Phosphorus (mg)a | 1053.1 ± 335.7 | 990 ± 315 | 1093.2 ± 273.5 | 0.458 |
| Iron (mg)b | 15 (11.92-21.21) | 13.42 (10.64-17.95) | 15.71 (12-20.86) | 0.324 |
| Zinc (mg)b | 11.86 (7.78-14.57) | 9.6 (7.21-13.35) | 8.71 (6.86-11.86) | 0.429 |
| Selenium (mcg)b | 72.86 (54.92-112.57) | 71.86 (49.85-85.5) | 75.86 (58-90) | 0.512 |
| Iodine (mcg)a | 145.4 ± 65.2 | 138.6 ± 64.4 | 161 ± 58.9 | 0.424 |
g: grams; IBS-C: constipation predominant irritable bowel syndrome; IBS-D; diarrhea predominant irritable bowel syndrome; IBS-M: irritable bowel syndrome, mixed type; IQR: interquartile range; mcg: micrograms; mg: milligrams; SD: standard deviation.
The subjects with IBS consumed food with a high content of fermentable oligosaccharides, disaccharides, monosaccharides, and polyols (FODMAPs). This was especially notable in products containing lactose (dairy products), galacto-oligosaccharides (legumes), and fructose (fruits). Relevantly, the consumption of those foods was similar to that of the healthy controls. IBS subjects consumed vegetables, cereals, and fats with a low FODMAP content more often. On the other hand, the healthy subjects had a higher intake of fructo-oligosaccharides (in cereals) and oils (Fig. 3).
 had a higher intake of high-content FODMAPs in the dairy, legume, and fruit groups, whereas the healthy subjects had a higher intake of high-content FODMAPs in the dairy, legume, fruit, cereal, and oil groups. Source: This figure is original and authored by me.")
The FODMAP content “traffic light” per food group. Subjects with irritable bowel syndrome (IBS) had a higher intake of high-content FODMAPs in the dairy, legume, and fruit groups, whereas the healthy subjects had a higher intake of high-content FODMAPs in the dairy, legume, fruit, cereal, and oil groups.
Source: This figure is original and authored by me.
Our results indicate there were subtle differences in dietary composition, between patients with IBS and healthy subjects. It is relevant that the caloric intake in IBS subjects was higher, partially explaining the overweight in that group. Even though that is not completely described in IBS, attention should be paid to underlying eating disorders.
Saito et al. found that patients with gastrointestinal disorders consumed more saturated and monounsaturated fats and relatively fewer carbohydrates.15 With respect to fat intake, the results were similar in our study, given that monounsaturated fat intake was higher in the IBS patients, albeit not statistically significant. The higher intake in those patients could be due to the fact that said fats are catalogued as healthy and found in foods, such as avocado, nuts, seeds, and olive oils, and are consumed in an effort to improve digestive health.16
The daily recommended intake of dietary fiber in the general population is 20-30 g, whether from natural sources or supplements.17 We found that the fiber intake of our study participants was below said recommendations. Only 25% of the subjects with IBS reached the recommended intake values but their mean fiber consumption was slightly higher, reaching 18.6 g, than that of the healthy subjects, at 16.8 g. However, the difference was not statistically significant.
Interestingly, in the subtype analysis, the patients with IBS-M had a higher fiber intake but the patients with IBS-C did not; despite their having the predominant symptom of constipation, those patients only consumed an average of 18 g per day.
With respect to micronutrients, Roth et al. evaluated dietary intake in 105 patients with IBS. They reported that micronutrient intake was below the recommendations, especially regarding iron and selenium.18 In addition, different studies have found inadequate intake of vitamins A, B2, B6, B9, and B12, as well as of calcium and zinc, in the usual diet of patients with IBS.19 Those findings are consistent with our results, which indicated that a considerable number of IBS patients had intakes of calcium, iron, magnesium, zinc, and vitamins A, D, E, and B9 below the daily recommendations. Nevertheless, compared with the healthy controls, the IBS patients had significantly higher intakes of vitamins D, B1, B2, and B3, and in the IBS subtype analysis, vitamin B3 was significantly higher in the IBS-M subtype. Those results could have been influenced by dietary modifications, such as the inclusion of healthy and enriched foods, such as whole-grain cereals or enriched vegetable alternatives, among others.20
Zhang et al. reported that elevated magnesium intake was inversely proportional to the presence of constipation, due to its osmotic laxative effect, given that it is incompletely absorbed in the gastrointestinal tract.21,22 However, in our results, magnesium intake was higher in the healthy controls, with no statistically significant difference. The importance of adequate vitamin and mineral intake lies in their participation in nutrient absorption, intestinal motility, and gut microbiota modulation, among other essential physiologic processes.23
Böhn L et al. conducted a comparative study on the nutrient intake of subjects with IBS and the general population, through a 4-day food diary. The dietary components were very similar, but there was a greater intake of vitamin E, folate, iron, and vitamin C and a lower intake of vitamin A, riboflavin, calcium, and potassium, in the IBS subjects. They concluded that the differences in nutrient intake indicated a tendency toward a higher consumption of fruits and vegetables and a lower consumption of meats and dairy products in patients with IBS.24 Given the above, it has been established that when eliminating a specific food, its replacement is sought in accordance with its nutritional content, to prevent nutritional deficiency in those patients.8
In the study carried out by Torres MJ et al. in France, those authors collected the dietary data of 36,448 individuals, each of them with at least 3 self-administered 24 h registers. The results indicated that the patients diagnosed with IBS presented with a higher total caloric intake, concurring with our study findings. In addition, they identified significant differences in monounsaturated fat intake, which was increased in the IBS patients. However, in contrast with our study results, they described a higher consumption of fiber in the healthy subjects of their analysis. Likewise, calcium, potassium, zinc, and vitamin B2, B5, and B9 intake was significantly lower in the patients with IBS, compared with the healthy controls.25 It should be pointed out that even though calcium intake results were not statistically significant in our findings, there was a decrease in the IBS patients, compared with the healthy subjects, with 25% of the patients meeting the daily intake recommendations. This could be attributed to the fact that the IBS patients reported greater intolerance to dairy products that could be associated as symptom triggers. Therefore, when evaluating IBS patients, risk factors for osteopenia should be contemplated. 26
FODMAP-rich foods represent a wide variety of dietary compounds that are present in the human diet, encompassing the categories that include fruits, vegetables, legumes, cereals, bee products, dairy products, and sweeteners. The mean daily FODMAP intake in a conventional diet is estimated at 15 to 30 g.27 According to the classification adopted by Monash University, dairy products, especially cow’s milk, yogurt, and ice cream, are foods with a high FODMAP content. Practically all legumes, especially beans, fall into that same category, as do apples, watermelon, pears, and mangoes, in the fruit group.28 Pertinently, many of those foods are easily accessible and very common in the Mexican diet.
Even though IBS is more prevalent in women, a meta-analysis that examined the impact of diet on its prevalence found no significant correlation between dietary intake and the prevalence of IBS, in relation to sex.29 Nevertheless, the slight differences seen in the dietary changes between men and women could suggest a true behavioral variation, with respect to the predisposition to modify or report their dietary patterns.30
One of the limitations of our study was its reduced sample size, which impeded a detailed evaluation of the macronutrient and micronutrient intake in different age groups. Another was the use of the Nutrimind® program, which despite having been developed in Mexico, did not include typical regional ingredients in its catalogue, forcing us to employ equivalents that might not exactly reflect the usual diet of the population studied. The daily food registering and monitoring for the study could also have had an individual impact on the quantity and frequency of certain foods. In addition, we had no information on the presence or severity of symptoms in the IBS patients, nor did we have information on whether they had previously modified their dietary intake, to reduce symptoms or for some other reason.
ConclusionIn conclusion, the diet of patients with IBS was comparable to that of the healthy controls and did not negatively affect nutrient intake. The majority of the diets met the daily macronutrient and micronutrient recommendations for the Mexican population. Notably, in our population with IBS, FODMAP consumption was high, and fiber intake was low, despite the prevalence of IBS-C. Therefore, adopting a personalized nutritional focus in the initial evaluation of IBS patients is essential. Dietary adjustments can significantly contribute to general improvement, treatment efficacy, and as a consequence, improved quality of life, an aspect that is often deteriorated in IBS patients.
Financial disclosureNo financial support was received in relation to this study/article.
The authors declare that there is no conflict of interest.

